


The minimum detectable effect (MDE) is the smallest true effect that an experiment can reliably distinguish from random noise, given its sample size, the variability of the outcome, the significance level and the desired statistical power. In marketing, it is the smallest sales lift, or the corresponding incremental ROAS (iROAS), that a lift test is designed to detect.
Why the MDE matters
The MDE is a property of the test design, not of the result. It is calculated before launch and answers a simple question: if the campaign works as well as we expect, will this test be able to show it? Bloom (1995) proposed the MDE as a simple way to report the statistical power of an experiment, because an effect in the units of the outcome, such as euros of sales, is easier to interpret than a standardized effect size.
If the true effect is smaller than the MDE, the test will usually end with "no significant effect" even when the advertising works. That says little about the channel and mostly shows that the test was too small.
Formula
For a comparison between a test group and a control group, the MDE is a multiple of the standard error (SE) of the estimated effect:
MDE = (z1−α/2 + z1−β) × SE
Here α is the significance level and 1 − β is the statistical power, the probability of detecting an effect of exactly the MDE. With the common choices of a two-sided 5% significance level and 80% power, the multiplier is 1.96 + 0.84 ≈ 2.8, so MDE ≈ 2.8 × SE. For a one-sided test at the same levels, the multiplier is 2.49 (Bloom, 1995). The 80% power level is a convention proposed by Cohen (1988) for general use, not a law.
For two equal groups of n units each, with a standard deviation σ of the outcome per unit, SE = σ × √(2/n). Solving for the sample size gives roughly n ≈ 16σ² / MDE² per group. The required sample grows with the square of the precision you ask for: halving the MDE takes about four times as many independent units, such as users or regions.
Worked example
A retailer plans a six-week geo lift test that adds EUR 150 000 of online video spend in a set of test regions. Without the test, those regions would sell about EUR 2 000 000 in six weeks. A placebo analysis, which applies the same method to past periods with no media change, puts the standard error of the incremental sales estimate at about EUR 50 000. The marketing mix model suggests an iROAS of about 0.8 for the channel.
| Design | Extra spend | SE of incremental sales | MDE (sales and lift) | MDE as iROAS |
| Base design | EUR 150 000 | EUR 50 000 | EUR 140 000 (7.0%) | 0.93 |
| Double the spend change | EUR 300 000 | EUR 50 000 | EUR 140 000 (7.0%) | 0.47 |
| Better-matched control regions | EUR 150 000 | EUR 35 000 | EUR 98 000 (4.9%) | 0.65 |
In the base design, MDE = 2.8 × EUR 50 000 = EUR 140 000, a 7.0% lift on EUR 2 000 000. Divided by the extra spend, the smallest detectable iROAS is 140 000 / 150 000 ≈ 0.93. The expected iROAS of 0.8 is below that, so the base design would probably end inconclusive. Doubling the spend change halves the MDE in iROAS terms, and better-matched control regions reduce the noise itself. Either change makes an iROAS of 0.8 detectable. The numbers are illustrative.
What determines the MDE
- Noise in the outcome. The more sales vary between days or customers, the larger the MDE.
- Number of units and test length. More users, regions or days reduce the standard error, but only with the square root of the sample.
- Allocation. For a fixed total sample, an even split is most precise. A small holdout group keeps more of the audience exposed but raises the MDE.
- Size of the media change. A go-dark test or a large heavy-up creates a bigger signal than a small budget change, which lowers the MDE in iROAS terms.
- Quality of the counterfactual. In geo tests, how closely the control regions track the test regions before the test largely sets the noise level.
MDE in incrementality testing
Advertising effects are small compared with the normal variation in what people buy. In 25 large field experiments with US retailers and brokerages, Lewis and Rao (2015) found that the median confidence interval for return on investment, as they measured it, was over 100 percentage points wide, and that informative experiments can require more than 10 million person-weeks of data. User-level tests such as a conversion lift study have many units but small individual effects; geo tests capture total sales, including offline, but have far fewer units.
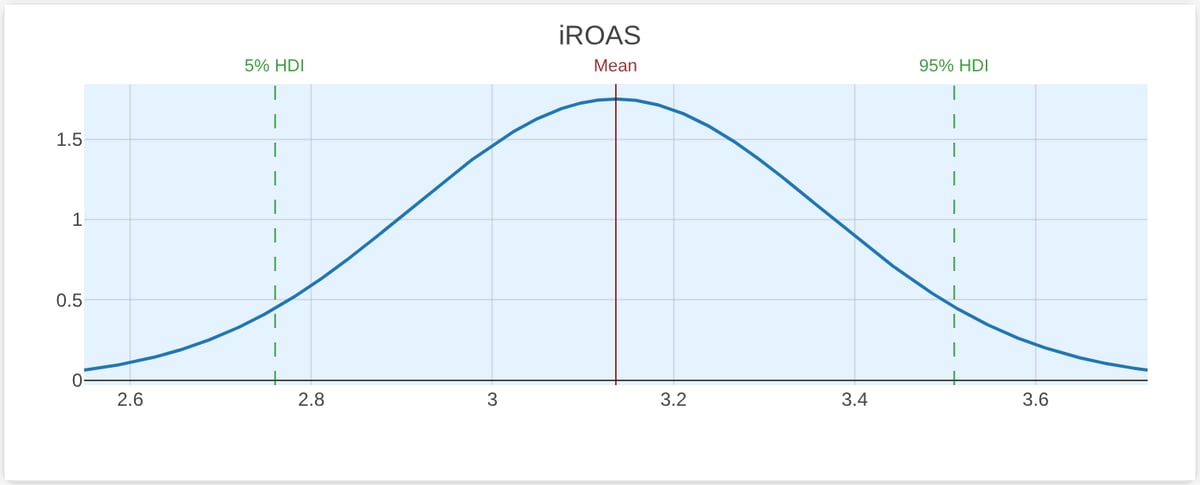
The two charts below show the estimated iROAS distribution from two conversion lift studies in the Sellforte demo (demo data). In the first, the 90% interval runs from −0.13 to 5.45. The test cannot rule out zero, and it cannot tell a weak campaign from a strong one.
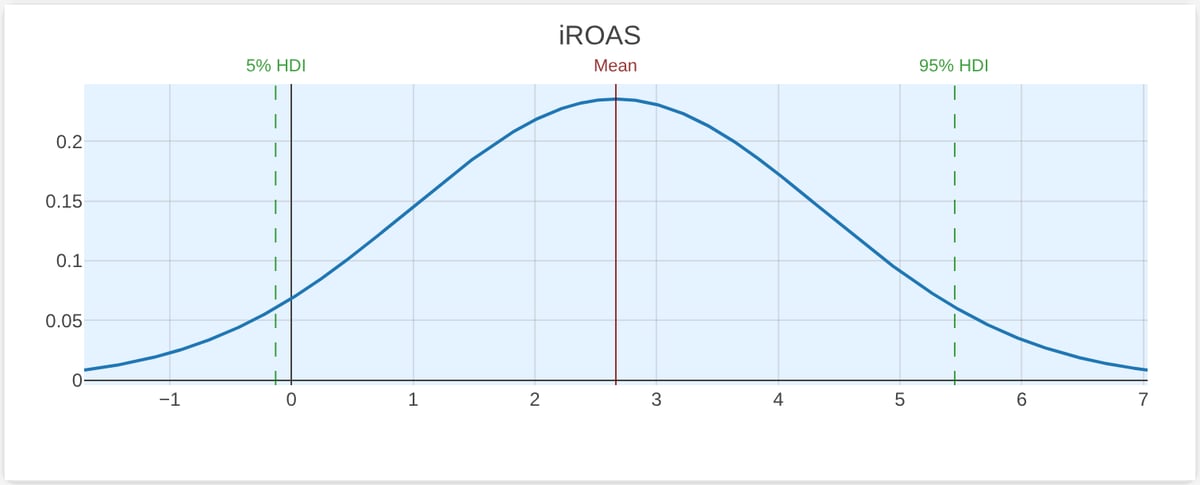
The second test, which among other differences covered about three times the spend, has a 90% interval of 2.76 to 3.51, precise enough to inform a budget decision. Note that the horizontal axes of the two charts have different ranges.
For geo tests, the MDE is usually estimated by simulation on historical data rather than by a closed-form formula. Meta's open-source GeoLift package, for example, runs a power analysis that reports the MDE and the minimum investment needed for each candidate set of test markets (Meta, n.d.).
Choosing the MDE from the decision
The MDE should come from the business question, not from whatever the test happens to be able to detect. Online experimentation practice separates statistical significance from practical significance, the smallest change that is worth acting on (Kohavi, Tang & Xu, 2020). In marketing, that threshold is often an iROAS: for example, the break-even level below which the budget would be cut. A test that can only show that the effect is above zero may not resolve the budget question. The Sellforte post on when a market or channel is too small to test covers this trade-off in practice.
Underpowered tests also mislead when they do reach significance. If the MDE is large compared with the true effect, the estimates that happen to pass the threshold tend to exaggerate the effect and can even have the wrong sign. Gelman and Carlin (2014) call these Type M (magnitude) and Type S (sign) errors and recommend basing design calculations on a plausible effect size from outside the study, not on the noisy estimate itself.
MDE and marketing mix modeling
A marketing mix model and an experiment support each other. At the design stage, the model's iROAS estimate for a channel is a natural input for the expected effect: if the planned test's MDE is above it, the test needs more spend, more units or a longer run. After the test, the result can be used to calibrate the model, and a precise result constrains the model more than a wide one; Sellforte, for instance, calibrates its MMM with lift test results.
Key takeaways
- The MDE is the smallest true effect a test can reliably detect; it is set by the design before launch.
- With a two-sided 5% significance level and 80% power, MDE ≈ 2.8 × the standard error of the estimate.
- Halving the MDE needs about four times the sample; a larger media change lowers the MDE in iROAS terms.
- Set the MDE from the iROAS that would change the budget decision, and use MMM estimates as the expected effect.
- An inconclusive result from an underpowered test is not evidence that a channel does not work.
Related terms
- Holdout group
- Geo lift test
- Conversion lift study
- Incrementality
- Counterfactual
- Synthetic control method
- Bayesian statistics
Further reading on Sellforte
- What is the right holdout-group size for an incrementality test?
- When is a market or channel too small to justify an incrementality test?
- How do you know if an incrementality test is credible?
- What is incrementality testing?
References
- Bloom, H. S. (1995). Minimum detectable effects: A simple way to report the statistical power of experimental designs. Evaluation Review, 19(5), 547–556. https://doi.org/10.1177/0193841X9501900504
- Cohen, J. (1988). Statistical power analysis for the behavioral sciences (2nd ed.). Lawrence Erlbaum Associates. https://www.routledge.com/Statistical-Power-Analysisfor-the-Behavioral-Sciences/Cohen/p/book/9780805802832
- Gelman, A., & Carlin, J. (2014). Beyond power calculations: Assessing Type S (sign) and Type M (magnitude) errors. Perspectives on Psychological Science, 9(6), 641–651. https://doi.org/10.1177/1745691614551642
- Kohavi, R., Tang, D., & Xu, Y. (2020). Trustworthy online controlled experiments: A practical guide to A/B testing. Cambridge University Press. https://doi.org/10.1017/9781108653985
- Lewis, R. A., & Rao, J. M. (2015). The unfavorable economics of measuring the returns to advertising. The Quarterly Journal of Economics, 130(4), 1941–1973. https://doi.org/10.1093/qje/qjv023
- Meta. (n.d.). GeoLift walkthrough. GeoLift documentation. Retrieved November 20, 2026, from https://facebookincubator.github.io/GeoLift/docs/GettingStarted/Walkthrough
Authors

Dr. Paavo Niskala is a Principal Engineer at Sellforte. With PhD in the field of computational plasma physics, he has over 10 years of experience in designing and building complex data-intensive systems. Paavo has especially focused on using data science in critical business applications, such as Marketing Mix Modeling, which helps businesses make better marketing decisions. Follow Paavo in LinkedIn.


