


A conversion lift study is a randomized experiment, run inside an ad platform such as Meta or Google Ads, that measures how many conversions a campaign causes. The platform splits the audience into a test group that can see the ads and a control group that cannot, and the difference in conversions between the groups is the incremental lift.
How a conversion lift study works
Attributed conversions count people who converted after interacting with an ad, including many who would have bought anyway. A conversion lift study answers a different question: how many conversions would not have happened without the ads? It does this with a randomized holdout group. In a Meta lift study, the platform randomizes the audience and assigns Accounts Center accounts either to a test group that sees the ads or to a control group that does not (Meta, n.d.). Google's user-based Conversion Lift likewise compares users who saw ads with users who were held back from seeing them (Google, n.d.-c).
Because assignment happens before the campaign runs and by chance, the two groups have the same purchase intent on average, and the control group shows what would have happened without the ads. This is the definition of incrementality. Google notes that Conversion Lift results are counted separately from standard attributed conversions, which follow each conversion action's tracking settings and attribution rules (Google, n.d.-c).
Withholding ads from the control group is not trivial in an ad auction. Comparing everyone assigned to each group (intent-to-treat) is unbiased but noisy, showing the control group unrelated public service ads costs money, and "ghost ads" log the control users who would have seen the ad without showing it, which gives more precise estimates (Johnson, Lewis & Nubbemeyer, 2017).
Formula and worked example
Platforms often use unequal group sizes, for example a 90% test group and a 10% control group, so the control group's conversions are scaled to the size of the test group:
Incremental conversions = Test conversions − Control conversions × (Test group size / Control group size)
Relative lift = Incremental conversions / Scaled control conversions
Incremental ROAS (iROAS) = Incremental revenue / Ad spend
Suppose a retailer runs a four-week Meta prospecting campaign with a 10% holdout, spends EUR 60 000 and has an average order value of EUR 80:
| Metric | Value |
| Test group: users / conversions | 900 000 / 13 500 (1.50%) |
| Control group: users / conversions | 100 000 / 1 200 (1.20%) |
| Scaled control conversions (1 200 × 9) | 10 800 |
| Incremental conversions (13 500 − 10 800) | 2 700 |
| Relative lift (2 700 / 10 800) | 25% |
| Cost per incremental conversion (60 000 / 2 700) | EUR 22.22 |
| iROAS (2 700 × 80 / 60 000) | 3.6 |
| For comparison: platform-attributed ROAS (6 000 attributed conversions) | 8.0 |
In this example, the campaign caused 2 700 conversions, or 45% of the 6 000 conversions the platform attributed to it. Relative lift is sensitive to the size of the control group's baseline: Google points out that very large relative lifts are easy to get when control conversions are low, and that relative lift can be misleading when comparing studies (Google, n.d.-c). Incremental conversions, cost per incremental conversion and iROAS are more useful for budget decisions.
The readout below is a Conversion Lift study imported into the Sellforte demo (demo data): spend, incremental sales, test iROAS with its 90% interval, sales lift and the confidence level reported for the study.

Conversion lift on Meta and Google
- Meta. In the Marketing API, the control share of each test group is set as a percentage of the population, and a study can have several test groups, for example to find out which advertising approach works best (Meta, n.d.).
- Google Ads. Conversion Lift comes in two versions. In the user-based version, test groups are formed from aggregated user attributes, and results can be segmented, for example by age and gender. In the geo-based version, the groups are formed from geographic regions, offline data is supported, and the reported metrics include incremental ROAS and incremental cost. Conversion Lift is not available for all accounts (Google, n.d.-a).
Eligibility, minimum budgets and supported campaign types change over time, so check the current help pages before planning a study. A geo-based study is close to a geo lift test, except that the platform designs and analyzes it.
Why randomization matters
It is tempting to estimate lift by comparing people who saw an ad with people who did not, using statistical controls instead of a holdout. Large-scale comparisons at Facebook suggest this rarely works. Gordon et al. (2019) found that observational methods often failed to reproduce the results of randomized lift experiments, even with rich user data. Using hundreds of Facebook experiments as a benchmark, Gordon, Moakler and Zettelmeyer (2023) found that neither double/debiased machine learning nor stratified propensity score matching reliably recovered the experimental lift.
Limitations
- Statistical power. The effect of advertising on an individual's purchases is small compared with normal variation in purchases, so even experiments with millions of users can be too noisy to measure returns precisely (Lewis & Rao, 2015). Plan the holdout size and duration before launch.
- Narrow scope. A study measures one platform, audience, conversion definition and period. User-based studies count only the conversions the platform can match to users, which often leaves out store sales and other channels.
- Short windows. Effects that arrive after the measurement window, such as later repeat purchases, are not captured.
- Average, not marginal. The study's iROAS is the average return of the tested campaign at its spend level. It does not tell you the return on the next euro, which follows a response curve.
- Limited transparency. The platform that sells the media also runs the study, and advertisers cannot audit the randomization themselves. See Can you trust Meta Conversion Lift tests for MMM calibration?
Conversion lift studies in marketing mix modeling
A marketing mix model estimates the iROAS of every channel continuously, but correlated channels can make individual estimates uncertain. Lift studies provide causal evidence for specific campaigns, so they are a common input for calibrating the model, usually as Bayesian priors for the matching channel. The study and the model must be aligned first. Google's Meridian documentation, which calls these ROI priors, notes that the MMM's counterfactual is zero spend while an experiment may compare against reduced spend, that a short experiment may miss long-term effects, and that a wider prior is appropriate when it is uncertain how well a result translates to the model (Google, n.d.-b).
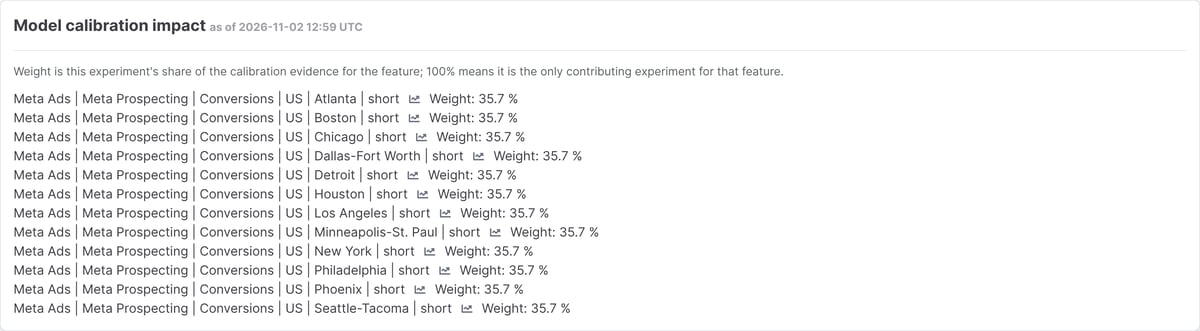
Sellforte imports Meta Conversion Lift studies, matches them to the corresponding MMM features and weights each study, for example by recency and statistical strength. The demo view below shows one study's share of the calibration evidence for each model feature (demo data).
Read more about the workflow on the Conversion Lift Studies page.
Key takeaways
- A conversion lift study is a randomized holdout experiment run by an ad platform. The difference in conversions between the test and control groups is the incremental effect of the ads.
- Report incremental conversions, cost per incremental conversion and iROAS rather than relative lift alone, and compare them with attributed results.
- Results apply to one platform, audience and period at the tested spend level. Align them with the model before using them to calibrate MMM.
Related terms
- Holdout group
- Geo lift test
- Incrementality
- Return on advertising spend (ROAS)
- Response curve
- Unified marketing measurement (UMM)
Further reading on Sellforte
- Introducing Sellforte MMM Calibration with Meta Conversion Lift Studies
- Why can a calibrated MMM show a different incremental ROAS than a conversion-lift study?
- How should geo-lift and conversion-lift studies be combined when calibrating MMM?
References
- Google. (n.d.-a). About Conversion Lift. Google Ads Help. Retrieved 2026-11-15, from https://support.google.com/google-ads/answer/12003020
- Google. (n.d.-b). Set custom ROI priors using past experiments. Meridian documentation, Google for Developers. Retrieved 2026-11-15, from https://developers.google.com/meridian/docs/advanced-modeling/set-custom-priors-past-experiments
- Google. (n.d.-c). Understand your Conversion Lift based on users measurement data. Google Ads Help. Retrieved 2026-11-15, from https://support.google.com/google-ads/answer/14102450
- Gordon, B. R., Moakler, R., & Zettelmeyer, F. (2023). Close enough? A large-scale exploration of non-experimental approaches to advertising measurement. Marketing Science, 42(4), 768–793. https://doi.org/10.1287/mksc.2022.1413
- Gordon, B. R., Zettelmeyer, F., Bhargava, N., & Chapsky, D. (2019). A comparison of approaches to advertising measurement: Evidence from big field experiments at Facebook. Marketing Science, 38(2), 193–225. https://doi.org/10.1287/mksc.2018.1135
- Johnson, G. A., Lewis, R. A., & Nubbemeyer, E. I. (2017). Ghost ads: Improving the economics of measuring online ad effectiveness. Journal of Marketing Research, 54(6), 867–884. https://doi.org/10.1509/jmr.15.0297
- Lewis, R. A., & Rao, J. M. (2015). The unfavorable economics of measuring the returns to advertising. The Quarterly Journal of Economics, 130(4), 1941–1973. https://doi.org/10.1093/qje/qjv023
- Meta. (n.d.). Lift Study. Marketing API documentation, Meta for Developers. Retrieved 2026-11-15, from https://developers.facebook.com/docs/marketing-api/guides/lift-studies
Authors

Dr. Paavo Niskala is a Principal Engineer at Sellforte. With PhD in the field of computational plasma physics, he has over 10 years of experience in designing and building complex data-intensive systems. Paavo has especially focused on using data science in critical business applications, such as Marketing Mix Modeling, which helps businesses make better marketing decisions. Follow Paavo in LinkedIn.


