


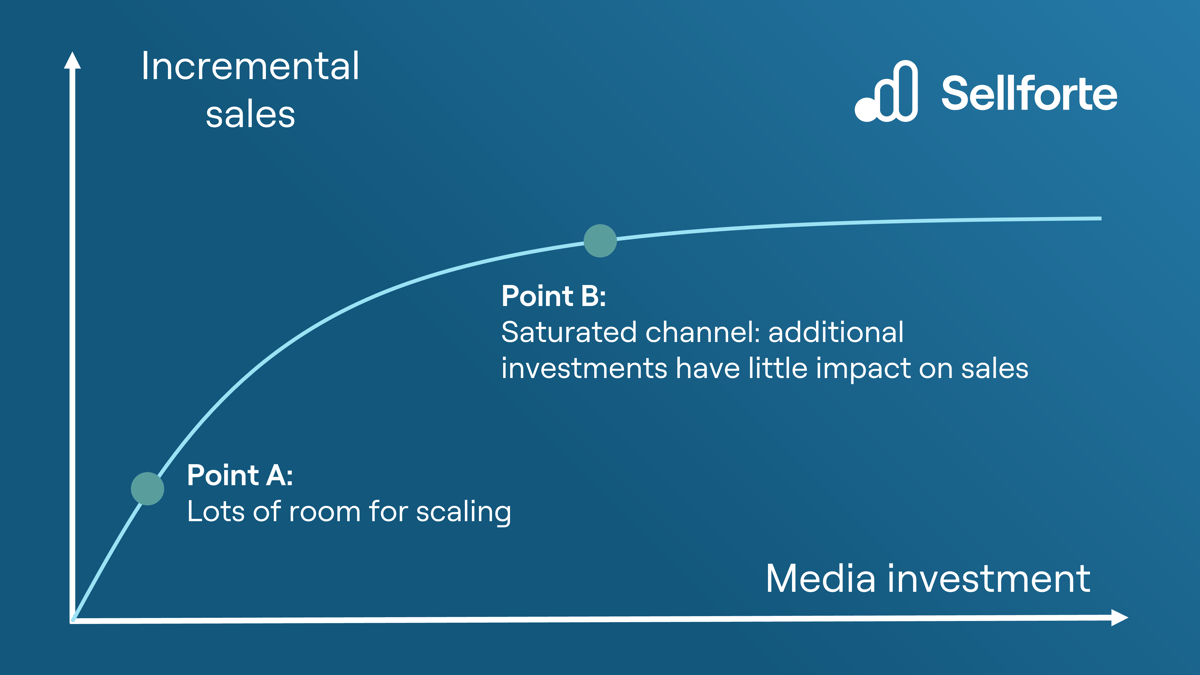
A response curve, also called a saturation curve, shows how the incremental sales or conversions driven by a marketing channel change as spend in that channel increases. Response curves typically flatten at higher spend levels because of diminishing returns, so each additional euro produces less incremental revenue than the one before.
Diminishing returns
The first euros invested in a channel usually reach the most responsive audience: people already in the market, searching for the product or likely to convert. As spend grows, the channel reaches people who are less interested, shows ads to the same people more often, or runs out of inventory. In search advertising, for example, the number of relevant queries is finite. Once a campaign's impression share approaches its maximum, extra budget mainly raises the cost per click rather than the number of clicks.
The response curve captures this pattern. Market response models in marketing science have long described sales as a non-linear function of marketing effort (Hanssens, Parsons & Schultz, 2001), and modern marketing mix models (MMM) estimate one curve per channel.
The chart below shows a response curve from marketing mix modeling. At point A the channel still has room to scale; at point B it is close to saturation and additional spend adds little incremental sales.
Curve shapes: concave versus S-shaped
Two shapes are used most often:
- Concave curves rise fastest at the start and flatten steadily. Every additional euro brings a smaller return than the previous one. This shape fits most always-on digital channels.
- S-shaped curves start flat, rise steeply once spend passes a threshold, and then flatten again. The threshold reflects the idea that a campaign needs a minimum weight before it is noticed. This shape is often assumed for TV and other high-reach media.
Both shapes can be produced by the Hill function, which Jin et al. (2017) use to model the shape effect of advertising in a Bayesian MMM. Google's open-source MMM Meridian uses the same form (Google Meridian documentation, n.d.):
Hill(x) = 1 / (1 + (x / EC)−slope)
Here x is the media input, EC is the half-saturation point (the input level at which the curve reaches half of its maximum effect) and the slope controls the shape. According to the Meridian documentation, a slope of 1 or less gives a concave curve, while a slope above 1 gives an S-shaped curve. The channel's incremental sales are this function multiplied by a coefficient that sets the curve's maximum.
Average ROI versus marginal ROI
A response curve separates two numbers that are easy to confuse:
- Average ROI (or incremental ROAS) is total incremental revenue divided by total spend. It answers: was the money spent so far worth it?
- Marginal ROI is the incremental revenue from the next euro of spend, which is the slope of the curve at the current spend level. It answers: should we spend more or less?
On a concave curve, marginal ROI is always lower than average ROI. The example below uses a Hill curve with a slope of 1, a half-saturation point of EUR 100 000 and a maximum effect of EUR 300 000 (illustrative numbers):
| Spend (EUR) | Incremental revenue (EUR) | Average ROAS | Marginal ROAS |
| 50 000 | 100 000 | 2.0 | 1.33 |
| 100 000 | 150 000 | 1.5 | 0.75 |
| 200 000 | 200 000 | 1.0 | 0.33 |
At EUR 100 000 of spend, the channel still shows an average ROAS of 1.5, which looks healthy. But the next euro returns only EUR 0.75, so increasing the budget would lose money even though the average looks profitable. Sellforte calls the marginal measure based on incremental sales marginal incremental ROAS (miROAS).
How MMM estimates response curves
An MMM estimates a channel's response curve from the relationship between its spend (or impressions) and sales over time, while controlling for other channels, seasonality, prices and promotions. Two transformations are applied to each media variable:
- Adstock spreads the effect of spend over the following weeks, because advertising works with a delay and its effect decays gradually.
- Saturation applies the Hill function or another curve to the adstocked input, producing diminishing returns.
Jin et al. (2017) apply the carryover transformation before the shape transformation, and Meridian does the same by default, while allowing the order to be reversed. In a Bayesian MMM, priors on the half-saturation point and slope keep the curves plausible when the data are weak. Jin et al. note that with small samples, priors strongly influence the posterior estimates.
Two practical limits follow:
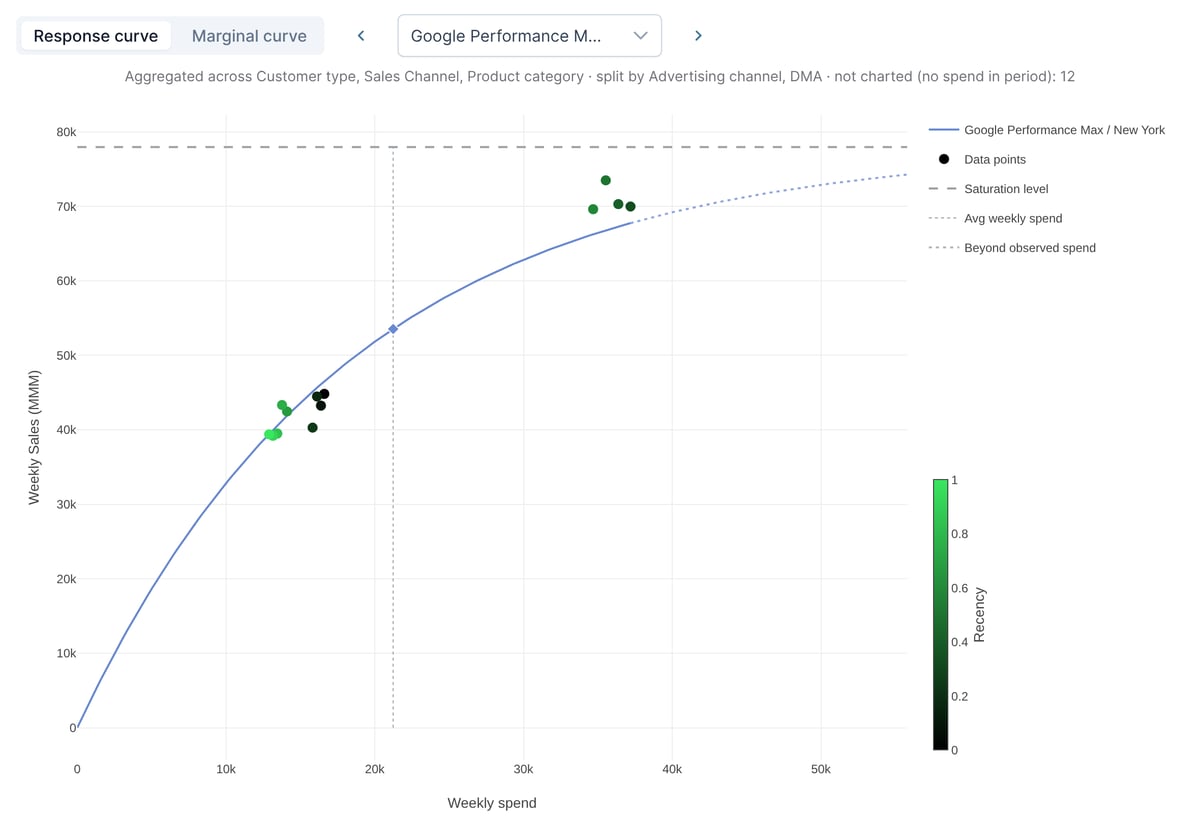
- Extrapolation is uncertain. A curve is estimated from the spend levels a channel has actually had. The Meridian documentation cautions that curves extended beyond the observed range should be interpreted carefully. Planned spend far above historical levels is a reason to run a test.
- Curves change. Creative, competition, seasonality and audience size all move the curve. Response curves for search, for example, shift with the volume of searches available each week.
The chart below from the Sellforte demo (demo data) shows one channel's estimated response curve with its weekly data points: the solid line covers the observed spend range, the dotted line is extrapolated beyond it, and the dashed line marks the saturation level.
Using response curves for budget optimization
Response curves turn MMM results into budget decisions. The rule is to equalize marginal returns: move budget from channels where the next euro returns little to channels where it returns more, until the marginal ROI is the same in every channel. At that point no reallocation can increase total incremental revenue for the same total budget.
In the example above, a channel at EUR 200 000 has a marginal ROAS of 0.33. If another channel has a marginal ROAS of 1.5 at its current spend, moving budget from the first channel to the second increases total incremental revenue, even if the first channel has the higher average ROAS. The total budget itself can be set by the same logic: keep increasing spend while marginal return, after margins and variable costs, is above break-even.
Budget optimizers in MMM tools solve this problem numerically across all channels at once, taking account of constraints such as minimum spend levels. For more on how curves are read and used in planning, see Advertising response curves: What are they and why do you need them?
In practice, the curves feed a budget optimizer. The example below from the Sellforte demo (demo data) compares channel-level budget allocation scenarios.

Key takeaways
- Response curves show diminishing returns: incremental revenue grows more slowly as spend increases.
- Average ROI shows whether past spend paid off; marginal ROI shows whether the next euro will.
- MMM estimates curves with adstock and saturation transformations, and budget optimization equalizes marginal returns across channels.
Related terms
Further reading on Sellforte
- Advertising response curves: What are they and why do you need them?
- Marginal Incremental ROAS (miROAS): What is it? And why does it matter to marketers?
- ROAS, iROAS, miROAS: Choosing the Right KPI for Optimizing Media Spend
References
- Google. (n.d.). Media saturation and lagging. Meridian documentation. Retrieved 2026-11-07, from https://developers.google.com/meridian/docs/advanced-modeling/media-saturation-lagging
- Hanssens, D. M., Parsons, L. J., & Schultz, R. L. (2001). Market response models: Econometric and time series analysis (2nd ed.). Kluwer Academic Publishers. https://doi.org/10.1007/b109775
- Jin, Y., Wang, Y., Sun, Y., Chan, D., & Koehler, J. (2017). Bayesian methods for media mix modeling with carryover and shape effects. Google Inc. https://research.google/pubs/bayesian-methods-for-media-mix-modeling-with-carryover-and-shape-effects/
Authors

Lauri Potka is the Chief Operating Officer at Sellforte, with over 15 years of experience in Marketing Mix Modeling, marketing measurement, and media spend optimization. Before joining Sellforte, he worked as a management consultant at the Boston Consulting Group, advising some of the world’s largest advertisers on data-driven marketing optimization. Follow Lauri in LinkedIn, where he is one of the leading voices in MMM and marketing measurement.


