


Impression share is the number of impressions your ads received divided by the estimated number of impressions they were eligible to receive. Google Ads reports it for Search, Display and Shopping campaigns. It shows how much of the available auction inventory you are winning, and how much is lost to budget or ad rank.
Formula and example
Impression share = Impressions received ÷ Estimated eligible impressions × 100
If your ads were shown 800 times and Google estimates they were eligible to be shown 1 000 times, impression share is 80%. Eligibility depends on your targeting settings, approval status, bids and ad quality; the denominator is an estimate made by the platform, not an observed count (Google Ads Help, About impression share).
For more on how the numerator is counted, see What are impressions?
Impression share metrics in Google Ads
Google Ads reports several variants (Google Ads Help, Get impression share data):
- Search impression share: impressions received on the Search Network divided by estimated eligible impressions there. Search partners are excluded from impression share data.
- Display impression share and Shopping impression share: the same ratio for the Display Network and Shopping ads. For Performance Max, Google combines Search and Shopping impressions in impression share.
- Search lost IS (budget): the percentage of time your ads weren't shown on the Search Network because of insufficient budget. Available at campaign level only.
- Search lost IS (rank): the percentage of time your ads weren't shown on the Search Network because of poor Ad Rank in the auction.
- Search top IS and Search absolute top IS: impressions received among the top ads, or in the very first ad position, divided by the estimated impressions you were eligible to receive among the top ads (Google Ads Help, About top and absolute top metrics).
What limits impression share
The lost impression share split is the diagnostic. Lost to budget means the campaign ran out of money during the day. Lost to rank means bids, ad quality or expected click-through rate were not competitive enough to win the auction. Narrow targeting and a stronger competitive field also lower the share, but those show up through rank rather than as a separate metric.
Increasing budget addresses lost IS (budget). Higher bids or better ads, landing pages and expected CTR address lost IS (rank). Broadening keywords or audiences changes the denominator, so the share can fall even when impressions grow.
Why impression share matters in marketing measurement
Impression share is one of the clearest explanations for diminishing returns in search advertising. A campaign at 40% impression share that is losing most of the rest to budget can usually buy more impressions at a similar cost. A campaign at 90% has few impressions left to win; the remaining ones are typically more expensive, lower-ranked positions or less relevant queries. Each additional euro buys less.
Diminishing returns are captured by response curves. The example below shows two points at different investment levels:
- At Point A, there is room to scale.
- At Point B, the channel or campaign is saturated, and additional investment drives little additional sales.
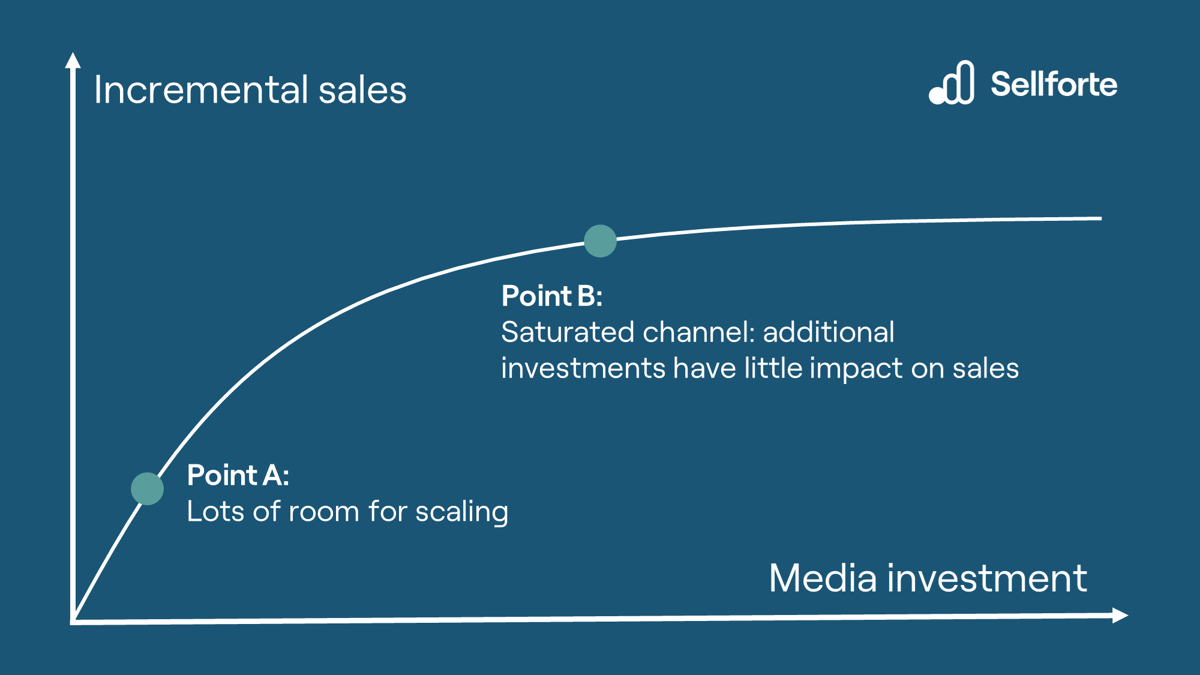
Response curves are estimated with marketing mix modeling (MMM), which typically uses a saturation function, such as the Hill function used by Jin et al. (2017), to represent this shape. Impression share is a useful diagnostic alongside the curve: if MMM shows a campaign near saturation and impression share is already high, the explanation is that the available demand has been bought.
High impression share does not mean high incremental return
Impression share measures auction coverage, not sales impact. This matters most in branded search, where most people searching for your brand would reach you anyway. In a large field experiment at eBay, Blake, Nosko and Tadelis found no measurable short-term benefit from brand keyword ads (Blake, Nosko & Tadelis, 2015). A brand campaign at near-100% impression share can therefore look efficient in platform reporting while adding little incremental revenue. See branded search advertising for more.
The budget question is therefore not "how do we reach 100% impression share?" but "what is the marginal incremental return of the next euro in this campaign compared with other channels?". That comparison requires an incrementality-based method such as MMM or a controlled experiment.
Impression share vs. related metrics
Impression share vs. reach: reach counts unique people exposed; impression share measures your position in the available auction inventory.
Impression share vs. share of voice: share of voice traditionally compares your advertising weight with competitors' across a category. Impression share is narrower: it is measured by one platform, against that platform's estimate of your eligible auctions.
Impression share vs. share of search: share of search measures your brand's share of organic search interest in a category, which reflects demand rather than paid coverage.
Key takeaways
- Impression share = impressions ÷ estimated eligible impressions; the denominator is a platform estimate.
- Lost IS (budget) and lost IS (rank) show why impressions were missed.
- High impression share often signals saturation and does not, on its own, indicate high incremental ROAS (iROAS).
Related terms
- Impressions
- Search engine marketing (SEM)
- Branded search advertising
- Keyword coverage
- Share of search
- Incrementality
Further reading on Sellforte
- Advertising response curves: what are they and why do you need them?
- Marginal incremental ROAS (miROAS)
- Should you include branded keyword paid search spend in MMM?
- Why diminishing return curves are crucial insights in marketing planning
References
- Google. (n.d.). About impression share. Google Ads Help. Retrieved 2026-10-30, from https://support.google.com/google-ads/answer/2497703
- Google. (n.d.). Get impression share data. Google Ads Help. Retrieved 2026-10-30, from https://support.google.com/google-ads/answer/7103314
- Google. (n.d.). About top and absolute top metrics. Google Ads Help. Retrieved 2026-10-30, from https://support.google.com/google-ads/answer/7501826
- Blake, T., Nosko, C., & Tadelis, S. (2015). Consumer heterogeneity and paid search effectiveness: A large-scale field experiment. Econometrica, 83(1), 155–174. https://doi.org/10.3982/ECTA12423
- Jin, Y., Wang, Y., Sun, Y., Chan, D., & Koehler, J. (2017). Bayesian methods for media mix modeling with carryover and shape effects. Google Research. https://research.google/pubs/bayesian-methods-for-media-mix-modeling-with-carryover-and-shape-effects/
Authors

Lauri Potka is the Chief Operating Officer at Sellforte, with over 15 years of experience in Marketing Mix Modeling, marketing measurement, and media spend optimization. Before joining Sellforte, he worked as a management consultant at the Boston Consulting Group, advising some of the world’s largest advertisers on data-driven marketing optimization. Follow Lauri in LinkedIn, where he is one of the leading voices in MMM and marketing measurement.


