


Marketing Efficiency Ratio (MER), also called blended ROAS, is a top-down metric that divides a company's total revenue by its total marketing spend over the same period. Because it uses total revenue rather than platform-attributed revenue, MER avoids attribution double counting, but it is not a causal measure of marketing impact.
MER formula
Marketing Efficiency Ratio (MER) = Total revenue / Total marketing spend
- Total revenue: all revenue in the period, typically from the ecommerce platform or the sales ledger, regardless of whether any channel claims it.
- Total marketing spend: all marketing costs in the period. Some teams include only paid media, others also include agency fees, influencer fees, creative production and tools.
MER is a practitioner term that spread among ecommerce and direct-to-consumer brands. It has no single standard definition, so check two conventions before comparing numbers between companies or tools:
- Which costs are included. "Blended ROAS" usually means total revenue divided by total paid media spend. "MER" is sometimes used for the same ratio and sometimes for a broader cost base. The broader the cost base, the lower the ratio.
- Which way the ratio is written. Some tools invert the formula and report marketing spend as a percentage of revenue. A MER of 5.0 equals a spend-to-revenue ratio of 20%.
Example calculation
An online store has 500 000 EUR of revenue in a month and spends 100 000 EUR on marketing across all channels.
| Total revenue | 500 000 EUR |
| Total marketing spend | 100 000 EUR |
| Marketing Efficiency Ratio (MER) | 5.0 |
MER vs ROAS
Return on Advertising Spend (ROAS) is usually reported per channel or campaign and uses revenue that the ad platform or an analytics tool attributes to the ads. MER uses total revenue and total spend. The difference has practical consequences:
| Metric | Revenue in numerator | Level | Causal? |
| Platform ROAS | Revenue attributed by the platform's own rules | Channel, campaign | No |
| MER / blended ROAS | All revenue, including base sales | Total business | No |
| Incremental ROAS (iROAS) | Revenue caused by the marketing activity | Channel, campaign or total | Yes, when estimated with MMM or experiments |
MER gained popularity because platform ROAS became harder to trust. Each ad platform attributes conversions with its own rules, so the same order can be claimed by several platforms, and the sum of platform-reported revenue can exceed the company's actual revenue. Privacy changes have also reduced the share of conversions platforms can observe. MER sidesteps both problems because it does not depend on tracking.
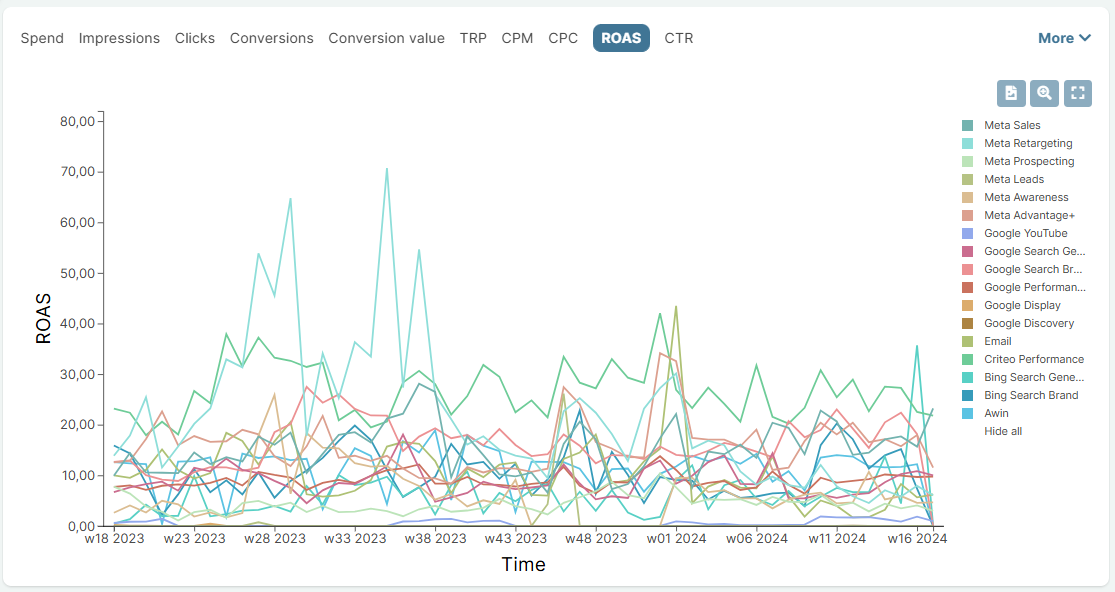
Channel-level ROAS shows how attributed revenue is spread across platforms, while MER collapses everything into one number. The view below from the Sellforte demo (demo data) shows ROAS by advertising channel.
What MER is useful for
- A business health check. MER is easy to calculate from data the finance team already has, and it is the same for every stakeholder.
- Trend monitoring. A falling MER while spend grows can be an early signal of diminishing returns or rising media costs.
- Break-even guardrails. Combined with gross margin, MER shows whether total marketing spend is in a sensible range. With a 40% gross margin, revenue must be at least 2.5 times marketing spend for marketing costs to be covered by the gross profit of all sales.
Why MER is not causal
MER puts all revenue in the numerator, including base sales that would have happened without any marketing: repeat purchases from loyal customers, organic search, word of mouth and seasonal demand. MER therefore answers "how much revenue do we have per euro of marketing?" and not "how much revenue does each euro of marketing create?".
This leads to three common misreadings:
- A brand with a large base looks efficient. An established brand can have a high MER even if much of its spend has little effect, because the base inflates the ratio.
- MER moves with things that are not marketing. Seasonality, price changes, stock availability and competitor actions all change revenue, and MER attributes the change to marketing efficiency.
- Cutting spend raises MER. Because base sales stay in the numerator, reducing spend usually increases MER in the short run even when the cut channel was profitable. Optimizing toward a MER target can therefore push budgets below the profit-maximizing level.
Research on advertising measurement shows why aggregate ratios cannot settle the question. Using 25 large field experiments with US retailers and brokerages, Lewis and Rao (2015) showed that advertising effects are small relative to the normal volatility of sales, so they are hard to detect even with very large samples. Comparing the results of large randomized experiments at Facebook with observational methods, Gordon et al. (2019) found that the observational methods often failed to recover the experimental effects. In eBay's paid search experiment, Blake, Nosko and Tadelis (2015) found no measurable short-term benefit from brand-keyword ads, because the customers would have reached the site anyway. All three point the same way: a ratio of revenue to spend does not tell you what the spend caused.
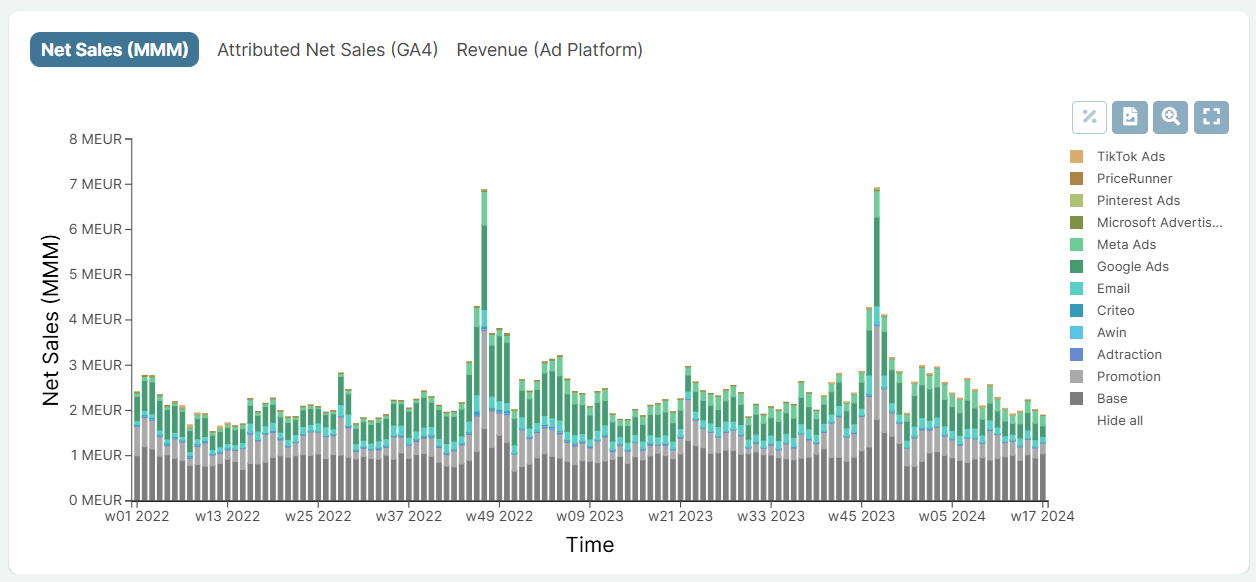
The sales decomposition below (Sellforte demo, demo data) shows why: MER divides all revenue by marketing spend, including the base sales at the bottom of the chart that would have happened without media. Only the media-driven layers are incremental.
MER vs iROAS
Incremental ROAS divides only the revenue caused by marketing by the spend. Continuing the example above, assume a marketing mix model estimates that 30% of the 500 000 EUR revenue is incremental to marketing:
| Total revenue | 500 000 EUR |
| Base sales (70%, estimated by MMM) | 350 000 EUR |
| Incremental revenue from marketing (30%) | 150 000 EUR |
| Total marketing spend | 100 000 EUR |
| MER | 5.0 |
| Total iROAS | 1.5 |
The two numbers describe the same business. MER says the company generates 5 EUR of revenue per euro of marketing. iROAS says marketing creates 1.5 EUR of revenue per euro spent. Only the second can be compared with margin to judge whether marketing pays back, and only an incremental measure broken down by channel shows where to move budget. For budget decisions at the margin, marginal iROAS is the relevant metric. The post ROAS, iROAS, miROAS explains the differences.
Incremental revenue is estimated with marketing mix modeling, incrementality experiments such as geo tests and conversion lift studies, or both (see incrementality). In Sellforte, MMM results calibrated with experiments give iROAS by channel and campaign, which can be shown next to MER and platform ROAS.
Key takeaways
- MER, or blended ROAS, is total revenue divided by total marketing spend. Conventions differ, so define the cost base before comparing numbers.
- MER avoids attribution double counting but includes base sales, so it is a health metric, not a measure of what marketing caused.
- Use incremental ROAS from MMM or experiments for budget allocation, and keep MER as a top-down sanity check.
Related terms
Further reading on Sellforte
- ROAS, iROAS, miROAS: Choosing the right KPI for optimizing media spend
- Why do platform ROAS and incremental ROAS tell such different stories?
- What changes when ecommerce and retail teams switch to incremental ROAS?
References
- Blake, T., Nosko, C., & Tadelis, S. (2015). Consumer heterogeneity and paid search effectiveness: A large-scale field experiment. Econometrica, 83(1), 155–174. https://doi.org/10.3982/ECTA12423
- Gordon, B. R., Zettelmeyer, F., Bhargava, N., & Chapsky, D. (2019). A comparison of approaches to advertising measurement: Evidence from big field experiments at Facebook. Marketing Science, 38(2), 193–225. https://doi.org/10.1287/mksc.2018.1135
- Lewis, R. A., & Rao, J. M. (2015). The unfavorable economics of measuring the returns to advertising. The Quarterly Journal of Economics, 130(4), 1941–1973. https://doi.org/10.1093/qje/qjv023
Authors

Lauri Potka is the Chief Operating Officer at Sellforte, with over 15 years of experience in Marketing Mix Modeling, marketing measurement, and media spend optimization. Before joining Sellforte, he worked as a management consultant at the Boston Consulting Group, advising some of the world’s largest advertisers on data-driven marketing optimization. Follow Lauri in LinkedIn, where he is one of the leading voices in MMM and marketing measurement.


