
Your attribution report says a campaign has a ROAS of 10. An incrementality test puts its incremental ROAS at 5. You still need to decide which campaigns and ad sets to invest in tomorrow.
Incrementality calibration brings that evidence into the report your team already uses. You calculate an incrementality factor from marketing mix modeling (MMM) or an incrementality test, then multiply attributed ROAS by the factor to estimate incremental ROAS.
Estimated incremental ROAS = Attributed ROAS × Incrementality factor
The calculation works with multi-touch attribution (MTA), GA4 attribution and ad platform reporting. Its usefulness depends on how you derive the factor, which campaigns you apply it to, and whether the original attribution signal is reliable enough for the job.
This guide covers the calculation, a worked campaign and ad set example, and the process for using calibrated attribution in reporting and budget decisions.
What is incrementality-calibrated MTA?
Incrementality-calibrated MTA applies correction factors to the revenue or ROAS reported by a multi-touch attribution model. The factors come from evidence about incremental impact, such as a controlled experiment or an MMM estimate.
MTA supplies the campaign detail. The factor adjusts that detail to an incremental estimate. A team can keep its existing attribution reports while adding a view of how much additional revenue the advertising is estimated to have generated.
The term can cause confusion because MMM also uses calibration. The distinction is which output you are correcting:
| Approach | What is being calibrated? | How the evidence is used |
|---|---|---|
| MMM calibration | The marketing mix model | Experiments and other evidence inform the model so it produces better estimates of marketing's contribution. |
| Incrementality-calibrating MTA | The revenue or ROAS reported by attribution | Factors derived from MMM or experiments multiply attributed results to estimate incremental results. |
These processes can follow each other. Experiments can first calibrate an MMM; the MMM's output can then supply the factors used to calibrate attribution. A team can also derive an attribution factor directly from a suitable experiment.
This article covers correcting the final attribution output. Changing the weights inside an MTA model is a separate implementation, with additional interactions between model training and the allocation of credit.
Why attributed and incremental ROAS differ
Attributed ROAS is credited revenue divided by advertising spend. Incremental ROAS, or iROAS, is the additional revenue caused by the advertising divided by the relevant spend.
A returning customer might already intend to buy, click a retargeting ad and complete a purchase. Attribution can correctly record that journey and credit the campaign. The journey alone does not tell you whether the purchase would have happened without the ad.
Attribution can also undercount a campaign. Someone may see an awareness ad, return later through another channel and buy without leaving a trackable click from the original ad. Online attribution can miss purchases made in a physical store as well.
These differences affect campaign comparisons. A high attributed ROAS can reflect strong existing purchase intent; a low number can reflect limited visibility into the campaign's effect. Neither is enough to establish incrementality.
Calibration gives you a way to adjust for the gap where suitable evidence exists. Our explanation of what to do when attribution and experiment ROAS disagree covers how to assess the two numbers before using either for a decision.
How to calculate an incrementality factor
An incrementality factor, also called a calibration multiplier, is the ratio between an incremental estimate and the corresponding attribution result:
Incrementality factor = Incremental ROAS from MMM or a test ÷ Attributed ROAS
For the opening example, 5 ÷ 10 = 0.5. Multiplying attributed ROAS by 0.5 gives the estimated incremental ROAS of 5.
You can calculate and apply the factor using revenue instead:
Incrementality factor = Incremental revenue ÷ Attributed revenue
Estimated incremental revenue = Attributed revenue × Incrementality factor
The revenue ratio and ROAS ratio are equivalent when the two ROAS figures use the same spend denominator. If they use different spend, reconcile that difference before calculating the factor.
Interpreting the multiplier
| Factor | Interpretation |
|---|---|
| Below 1 | The incremental estimate is lower than the attribution result, so calibration reduces reported ROAS. |
| Equal to 1 | The estimates agree for the defined scope. That agreement alone does not validate every campaign underneath it. |
| Above 1 | The incremental estimate exceeds attributed revenue, so calibration increases reported ROAS. |
The factor is a ratio between measurement outputs. It is not the probability that an individual purchase was incremental, and it is not limited to 100%. A factor above 1 can be reasonable when attribution misses relevant effects.
There is also no universal factor for a platform. A multiplier depends on the business, campaign mix and attribution source, as well as the period and outcome being measured. A factor calculated against MTA cannot simply be applied to Meta's own reporting.
Getting the factor from experiments or MMM
Using an incrementality test
Start with the incremental revenue estimated by a credible experiment. Retrieve attributed revenue for the same tested activity and relevant measurement period, then divide the incremental estimate by attributed revenue.
A conversion-lift study or geo-lift test may cover a campaign group rather than a single campaign. Preserve that scope. If the experiment measures a group, any further allocation to campaigns or ad sets requires an assumption or additional evidence.
Check what change the experiment tested, too. A comparison against no advertising and a test of an increase in budget answer different questions. An estimate of the return on additional spend should not automatically become a factor for all existing spend. Our guide to judging whether an incrementality test is credible explains the design and uncertainty checks.
Using MMM
Compare the MMM's incremental revenue estimate with attributed revenue for the same campaign group and period. The ratio supplies the multiplier for that group's attribution output.
MMM can connect experimental evidence with a broader view of marketing across channels and periods. The factor still inherits the model's assumptions and uncertainty. If attribution helped inform the MMM, agreement between the calibrated report and that model is not an independent validation of accuracy.
The wider roles of these methods are covered in why attribution needs MMM and incrementality testing.
Match the scope before dividing
| Check | What needs to be clear |
|---|---|
| Activity and market | The campaigns, ad sets, audiences and countries included in each number. |
| Revenue definition | Gross sales, net sales after returns, or another agreed outcome; use a consistent currency. |
| Sales coverage | Whether the estimate includes web, app or offline purchases. |
| Time horizon | The spending period, conversion lag and any post-test observation period. |
| Attribution settings | The source, attribution window and any redistribution of credit already applied. |
| Spend | The advertising cost associated with the measured effect, including whether the test concerns total or additional spend. |
Sometimes the scopes differ deliberately. An MMM may estimate offline sales generated by digital ads while attribution observes only online sales. That can support a multiplier for total sales impact, provided you label the result accordingly. It should not appear in a column described as online-only iROAS.
Future customer value also changes the outcome being estimated. Keep a CLV-inclusive result separate from revenue observed during the measurement period, and avoid counting the same future purchases twice. See our guide to Full iROAS and customer lifetime value for that broader measurement question.
Worked example: from campaign evidence to ad set estimates
Consider a hypothetical campaign with $10,000 in spend and $80,000 of attributed revenue. A credible test estimates $40,000 of incremental revenue for the same activity and period. Its attributed ROAS is 8; its incremental ROAS is 4.
The calibration factor is $40,000 ÷ $80,000 = 0.5. Equivalently, it is 4 ÷ 8 = 0.5.
Now suppose the campaign contains two ad sets. The table below allocates that campaign-level incremental estimate using each ad set's attributed revenue. All figures are illustrative; the shared factor is an assumption, not a separate test result for either ad set.
| Activity | Spend | Attributed revenue | Attributed ROAS | Factor | Estimated incremental revenue | Estimated iROAS |
|---|---|---|---|---|---|---|
| Ad set A | $5,000 | $50,000 | 10 | 0.5 | $25,000 | 5 |
| Ad set B | $5,000 | $30,000 | 6 | 0.5 | $15,000 | 3 |
| Campaign total | $10,000 | $80,000 | 8 | 0.5 | $40,000 | 4 |
The campaign total matches the test. The ad set split assumes attribution gets the relative contribution of A and B right. Calibration has corrected the total while retaining that allocation assumption.
When you use the factor on a later reporting period, you make another assumption: that the relationship between attribution and incremental revenue remains applicable. A change in campaign mix or measurement settings can break it.
Aggregating the results correctly
To calculate a campaign or portfolio iROAS, add estimated incremental revenue and divide by total spend. Do not take a simple average of ad set ROAS when their spend differs.
If groups have different factors, apply each factor to its group's attributed revenue first. Add those corrected revenue amounts to obtain the total. For positive attributed revenues, the equivalent overall factor is an attributed-revenue-weighted average of the group factors, not a simple average.
This is a reporting identity, not a rule for statistically pooling experiments. Separate tests may involve different interventions or overlapping effects, so their results require methodological review before combining them into one measurement system.
Choosing the right calibration level
The right calibration level balances meaningful differences between campaigns against the amount of evidence available. A single paid-social factor can combine prospecting, retargeting and awareness activity with different incremental effects and different attribution coverage.
Start by identifying distinctions that matter to the business and the measurement:
- Branded versus non-branded search.
- Prospecting versus retargeting audiences.
- Campaign objectives, such as sales, traffic or awareness.
- Markets or customer segments with materially different conditions.
Create separate factors where the evidence supports them. Where it does not, use a relevant broader group and make that inheritance visible. A new ad set may initially inherit its campaign group's factor; that should be described as a shared-factor estimate.
Applying the same positive multiplier to every ad set preserves their ROAS ranking. It can change the group's position relative to other groups with different multipliers, but it cannot repair a wrong ranking within that group.
This explains why a channel total can reconcile perfectly while individual campaign estimates remain questionable. One campaign type may need an upward correction and another a downward correction. More detail in the report does not create more detailed causal evidence.
Design future tests around the groups you want to calibrate. Separating materially different objectives into test cells makes the mapping easier. For a mixed test that already exists, document how its combined effect is allocated and investigate whether that rule favors the campaigns most visible to attribution.
How to implement attribution calibration
1. Define the decision and the metric
Choose the report and decision the calibrated number will support. For example, the performance team may want estimated incremental net revenue per dollar for its weekly campaign review. Agree on the market, revenue horizon and included sales channels with the people who use the report.
Start with a group that has credible evidence and usable attribution. Expanding from a well-understood group makes it easier to find mapping and reporting problems before they affect the whole account.
2. Build the campaign-to-factor mapping
Use stable campaign and ad set IDs to connect spend, attributed revenue and calibration groups. Names can change. Preserve the attribution source and settings alongside the revenue so that a factor cannot silently move between reports.
Check the join before applying any correction. Attributed revenue returned through the calibration workflow should reconcile with the source report for the same filters and dates. Missing IDs and duplicate rows can look like measurement disagreements.
3. Keep a record of each factor
A factor should have enough context that another analyst can reconstruct it. Record:
- The calibration group, market and attribution source.
- The test or MMM version supplying the incremental estimate.
- The incremental and attributed revenue used in the calculation.
- The measurement period, outcome definition and factor value.
- The uncertainty assessment, effective date and person responsible for review.
Version the records so that a changed factor does not erase the explanation for last month's decisions. Decide whether historical reports will retain the factor used at the time or be restated under the latest measurement, and label that choice.
4. Add calibrated columns to the report
Keep attributed revenue and ROAS visible. Add the factor, estimated incremental revenue and estimated iROAS next to them, with access to the source and date of the factor.
Flag activities that have no suitable factor. Assigning a default factor of 1 would imply agreement with attribution when you may simply lack evidence. Also distinguish a directly supported factor from one inherited from a broader group.
5. Reconcile and introduce the result to the team
Check that calibrated revenue sums to the source estimate over the calibration scope. Confirm that the report uses the correct spend when aggregating ROAS, and that later normalization or credit-redistribution steps do not undo the correction.
Explain the resulting change with both numbers in view: attributed revenue is what the model credited; calibrated revenue is the incremental estimate under the stated assumptions. The recorded sales have not disappeared because a campaign receives less credit.
Agree on how those estimates will inform campaign reviews before connecting them to automated actions. The organizational side of this work is discussed in our guide to putting measurement outputs into recurring business decisions.
Using the results for bids and budgets
Calibrated ROAS helps teams compare campaigns using an incremental outcome with a consistent definition. A campaign that looks attractive in attribution can become less attractive after correction; an activity that attribution undercounts can become more competitive.
Translating a target into the ad platform's terms
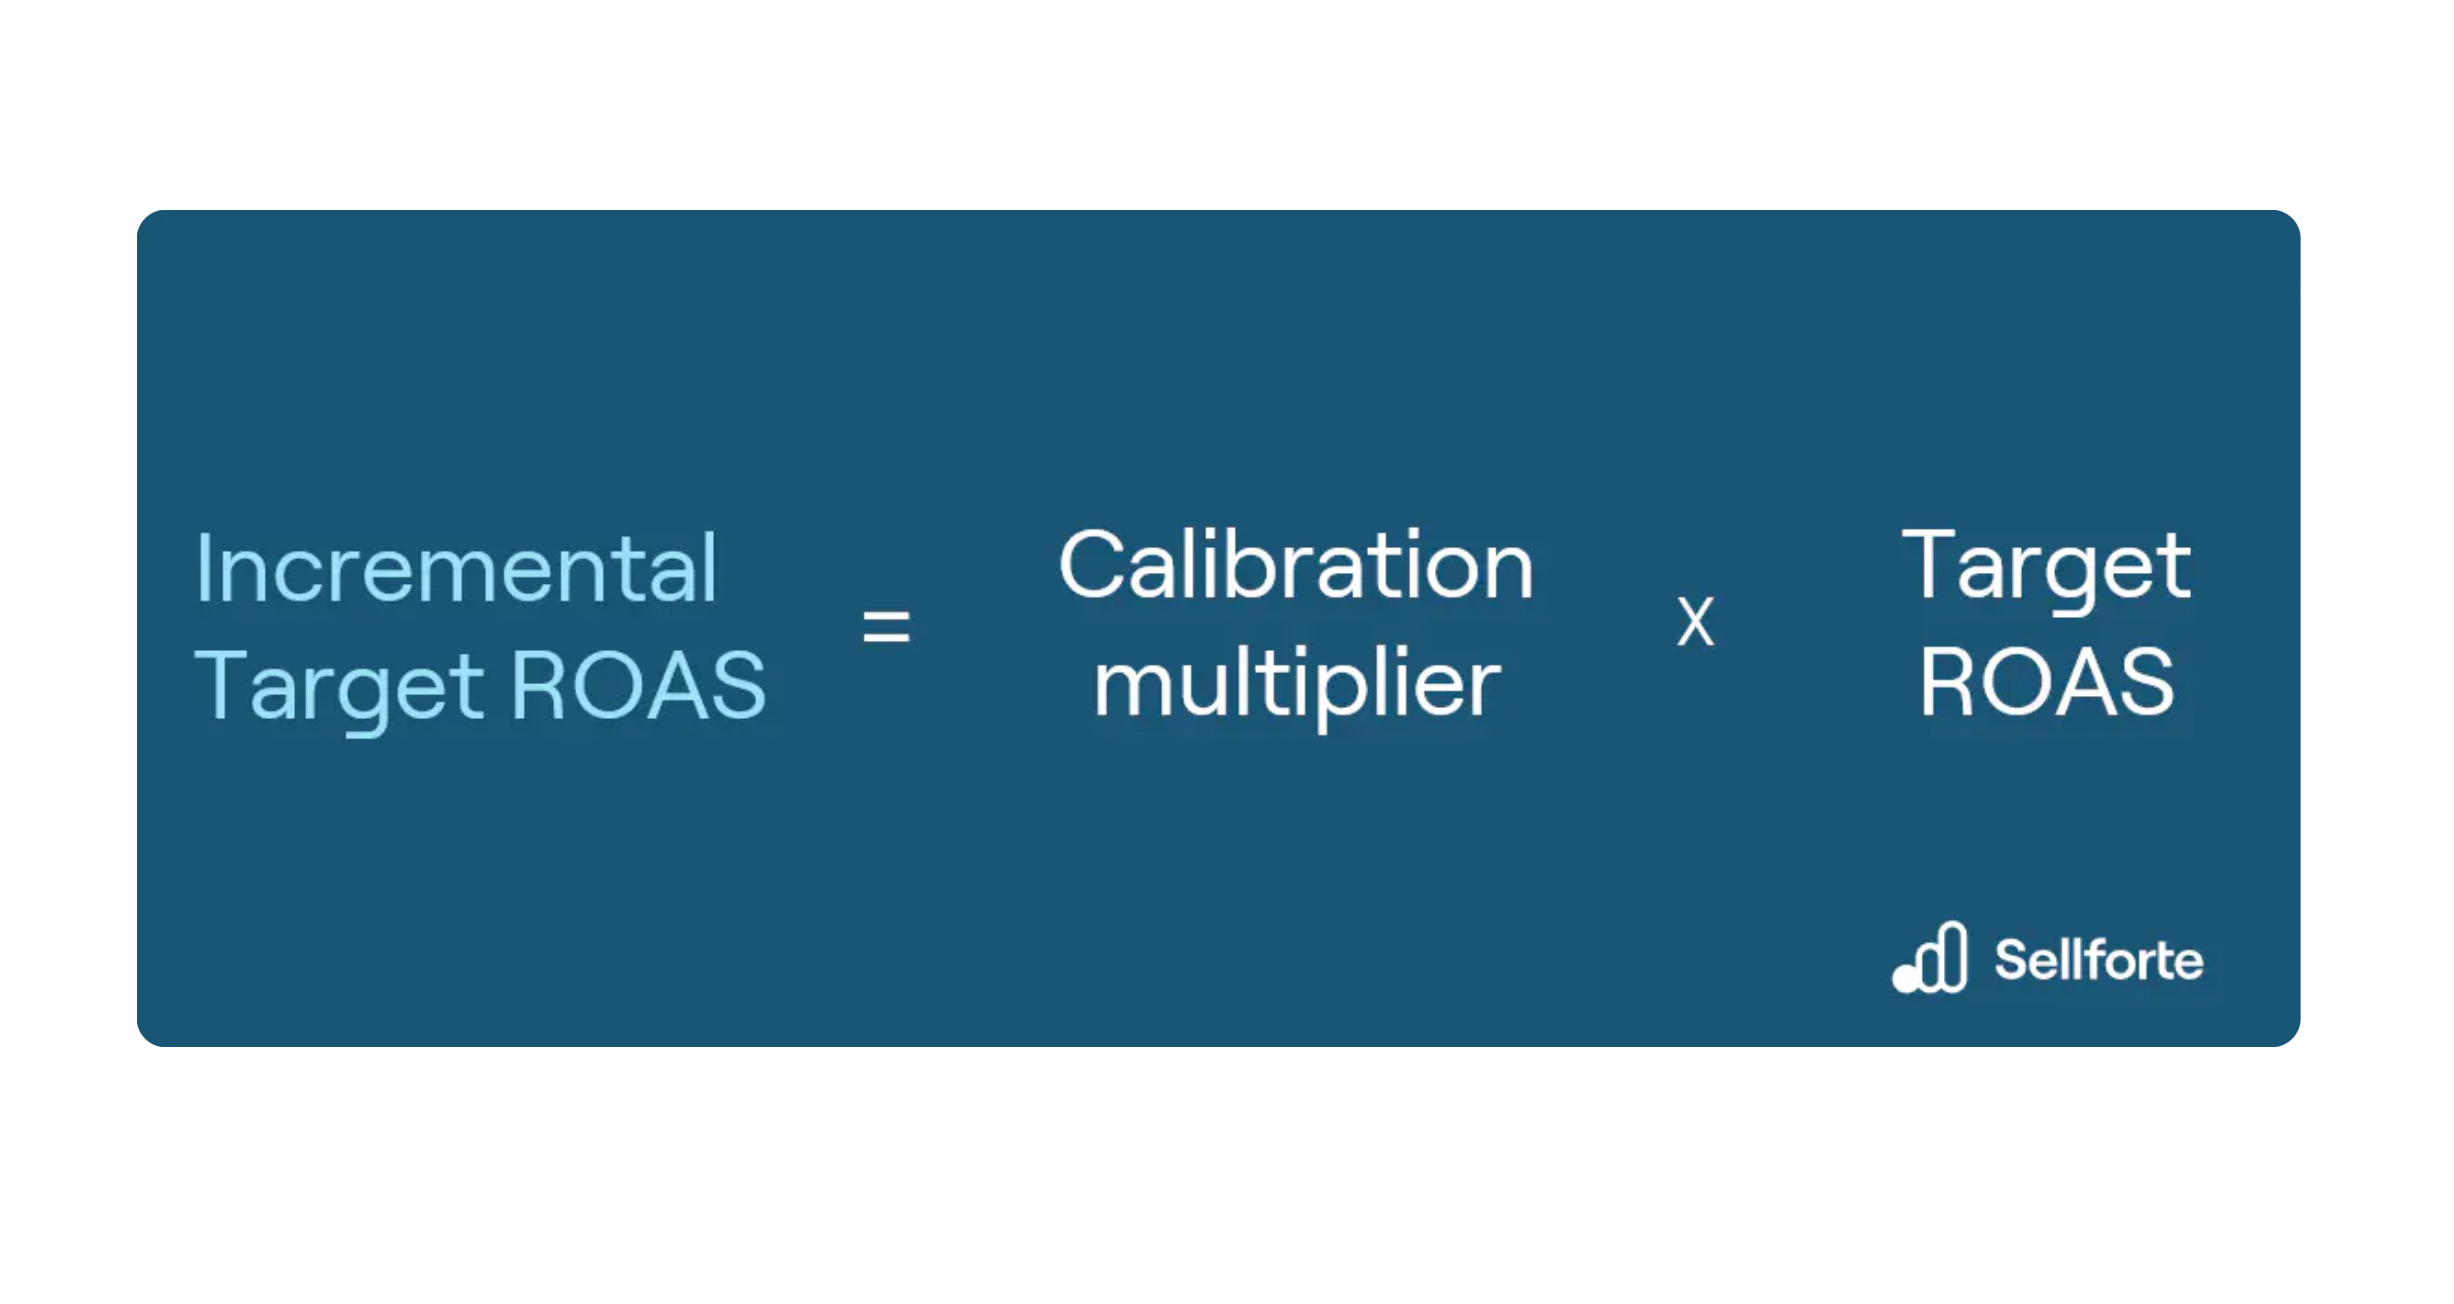
If the factor was calculated against the platform's own ROAS metric, you can translate an incremental target into that same metric:
Platform target ROAS = Incremental ROAS target ÷ Platform-specific incrementality factor
With a positive factor of 0.5 and a desired incremental ROAS of 5, the corresponding platform target is 10. This calculation translates the target between measurement systems; it does not guarantee the campaign will achieve either target.
Use the platform-specific factor for this step. An MTA factor corrects MTA reporting and cannot automatically be used to set a platform ROAS target. See how to set target ROAS using calibration multipliers for more examples.
Deciding where the next dollar should go
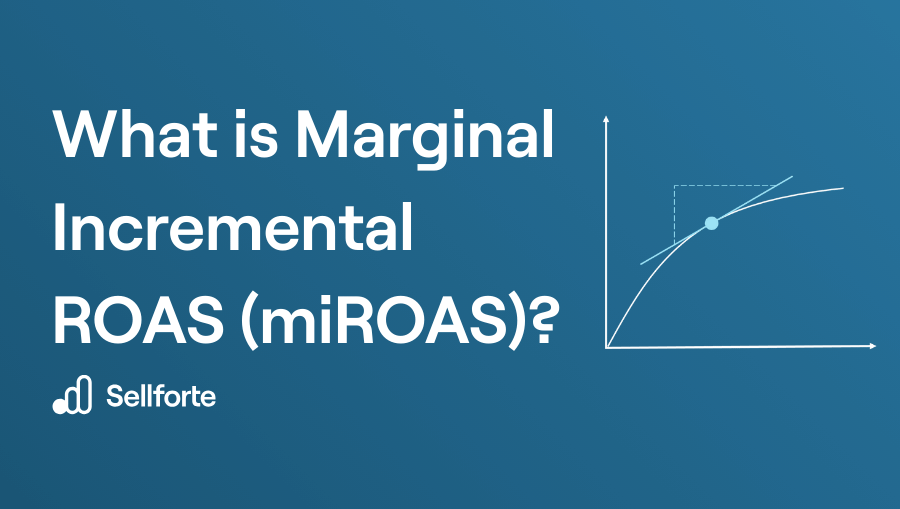
Calibrated ROAS describes the return on the spend being measured. Budget allocation also needs the expected return on the spend you plan to add or remove, often called marginal incremental ROAS.
A campaign can have high average iROAS and still be close to saturation. Another can have a lower average return but more room to grow. Use advertising response curves or evidence about the proposed spending change to assess that difference.
Likewise, revenue iROAS is not a profit metric. The return required by the business depends on margins and other relevant costs. Correcting attribution does not remove the need to agree on a commercially meaningful target.
Validating and refreshing the factors
Reconciliation checks whether the calculation was implemented correctly. Validation asks whether the resulting estimate is credible. Both are necessary.
A factor built from one test will reproduce that test's point estimate when applied to the original attributed revenue. This happens by construction. For additional evidence, compare it with other relevant tests or examine how well it holds under later, comparable conditions.
Carry uncertainty into the decision
A multiplier is not more certain than the evidence behind it. If the incremental estimate spans a wide range, a precise-looking factor can conceal that uncertainty.
When attributed revenue is treated as fixed and positive, dividing an incremental-revenue interval by attributed revenue gives the corresponding factor interval. Applying those factors gives a range of calibrated outcomes. That calculation captures the source interval only; uncertainty in attribution, allocation and future applicability needs separate consideration.
Check whether a decision changes across the plausible range. If it does, the team may need better evidence before making a large budget move.
Combine tests with a documented method
When several experiments inform a factor, consider their precision, recency and relevance to the current campaign mix. Spend weighting can reflect the amount of activity tested, but spend alone does not establish statistical reliability.
Keep weak and negative results in the evidence record. A result can be inconclusive, poorly designed or out of scope; those are different reasons for limiting its use. Rejecting results simply because they show low incrementality biases the evidence you retain.
Refresh when the relationship changes
New experiments and updated MMM results can justify a new factor. Recheck it when campaign objectives or audience mix change materially, or when spend moves beyond the conditions represented by the evidence.
Changes to attribution also matter: a new conversion event, a different window or altered brand-credit redistribution changes the denominator. The previous factor may no longer apply.
Daily reporting does not require a newly estimated factor every day. Set the review cadence according to how quickly the business and evidence change. Show the factor's date so a frequently refreshed dashboard does not make old evidence appear new.
Common problems and how to handle them
| Problem | What it means | What to do |
|---|---|---|
| Attribution reports zero revenue | A finite multiplier cannot turn zero into a positive estimate; the ratio is undefined. | Use a better-observed signal with its own factor, or report the test or MMM estimate directly at the supported level. |
| The multiplier is extremely large | A very small denominator or mismatched scope can make the ratio unstable. | Inspect tracking coverage, objectives and revenue definitions before interpreting it as exceptional performance. |
| Channel totals match but campaign results look implausible | The group factor may conceal different corrections within the group. | Review the grouping and allocation assumption. Seek more granular evidence where the decision warrants it. |
| Calibrated totals change after another reporting step | Normalization or redistribution may be changing the corrected values. | Trace the calculation through to the final report and preserve the intended incremental quantities. |
| A factor changes sharply | The evidence, campaign mix or attribution denominator may have changed. | Compare versions and isolate the cause before changing budgets automatically. |
| Every platform looks incremental on its own | Separately measured effects may overlap or rely on different outcomes and counterfactuals. | Review comparability and overlap before adding results into a cross-channel total. |
For awareness campaigns with little click-based attribution, a platform signal that includes view-through conversions may provide a more usable basis. It still needs its own incrementality calibration. Changing the signal does not make platform-reported revenue causal by itself.
Frequently asked questions
Do I need an MTA model to use incrementality factors?
No. The same calculation can calibrate GA4 or ad platform attribution. Derive the factor against the exact source and settings you plan to correct. MTA is one possible reporting input.
Do I need MMM, or can I start with a test?
You can start with a credible test and comparable attribution data for the tested activity. MMM is useful when you need a broader, ongoing view across channels and spending conditions. A single test-derived factor should remain scoped to the evidence supporting it.
Does calibrated MTA become a causal model?
Multiplication does not independently establish causality for every campaign or customer journey. The estimate borrows incremental evidence from the test or MMM and retains assumptions about how to allocate that effect. Describe the output as estimated incremental ROAS and explain where its evidence comes from.
Should calibrated revenue add up to total sales?
Calibrated paid-media revenue does not have to equal total business revenue. Some sales would have happened without the measured advertising. Rescaling paid-media estimates to absorb every sale would change the incremental quantities you intended to measure.
Can I use the same factor in another country?
Only with a defensible assumption that the relationship transfers. Compare campaign objectives, customer mix and measurement coverage, and use local evidence when available. A factor borrowed from another market should be identifiable as such.
What if the factor is zero or negative?
Investigate the source estimate and its uncertainty. A point estimate at or below zero may indicate no benefit, a harmful effect or insufficient precision to distinguish the effect. It should not be silently replaced with a convenient positive factor. The target-ROAS division above requires a positive factor and is not usable in this case.
How Sellforte connects incrementality and attribution
Sellforte combines incrementality testing, MMM and attribution to support campaign decisions. Performance Insights brings MMM-based incremental results, platform metrics and GA4 or MTA attribution into a campaign and ad set view. Teams can compare the measurement outputs for the same activity and investigate the differences.
The approach can work with an existing attribution system. In the published bonprix measurement case study, calibration factors from MMM feed back into the company's dynamic attribution model to inform bidding. The case describes how the measurement methods connect to the team's operating process.
For your own setup, start with the attribution report people use, a campaign group with credible incrementality evidence, and a clear outcome definition. Work through the factor calculation and reconciliation on that group before expanding the coverage.
Book a Sellforte demo to discuss how MMM or test-derived factors could be applied to your existing campaign reporting.
About the author

Lauri Potka is the Chief Operating Officer at Sellforte. He has over 15 years of experience in Marketing Mix Modeling, marketing measurement, and media spend optimization. Before joining Sellforte, he worked as a management consultant at the Boston Consulting Group, advising some of the world’s largest advertisers on how to use data to optimize marketing. Follow Lauri on LinkedIn.
How to Set a Target ROAS That Reflects True Incrementality

Why do platform ROAS and incremental ROAS tell such different stories?