

Context: A senior marketing leader saw paid media account for a smaller share of total sales than expected in the first MMM results and needed to know whether the result exposed weak marketing, a modeling error, or something else.
The short answer
A small media share means MMM estimates that most sales would have occurred through baseline demand or other drivers, not that media is necessarily inefficient. Contribution depends on both media investment and incremental return. Judge the result with iROAS, marginal iROAS, model scope, response curves, and experimental evidence before deciding to cut or increase spend.
This article is part of Asked by Marketers, a series answering real questions from marketing leaders.
Sellforte's team holds more than 1,450 meetings each year with marketing leaders in Ecommerce and Retail about Marketing Mix Modeling and incrementality testing. Each week, we anonymize at least one question from those conversations and answer it in depth, based on what marketers are actually struggling with, not what keyword tools suggest. About the series →
Why do marketers ask this?
A first sales decomposition can be uncomfortable. Ad platforms may credit a large share of online revenue to paid media, while the model assigns most sales to baseline demand, promotions, CRM, assortment, pricing, weather, or other factors. The paid-media slice can look surprisingly small next to the size of the marketing team and the attention the budget receives.
Marketers should not confuse three separate questions: How much of total sales did the current media budget create? What return did that budget earn? What would happen if the company invested one more or one less euro?
Marketing Mix Modeling can answer all three, but with different outputs. The sales decomposition shows historical contribution. Incremental ROAS shows the average return on existing spend. Marginal incremental ROAS and response curves estimate the return from changing that spend. A sensible budget decision needs the three views together.
What does media contribution actually measure?
Media contribution is the share of the modeled outcome that would not have occurred without the media included in the analysis. If MMM estimates that paid media generated $50 million of incremental sales from $500 million in total sales, paid media contribution is 10%.
Media contribution % = media-driven incremental sales / total sales
Media contribution % = media spend as % of sales × average iROAS
The second expression explains why the contribution share can be small. If a company invests 1% of sales in paid media and earns an average iROAS of 3, paid media creates incremental sales equal to roughly 3% of total sales. The 3% result is consistent with a healthy return. It also shows that contribution cannot be interpreted without knowing how much the company invested relative to the size of the business.
| Output | Question it answers | What it does not answer alone |
|---|---|---|
| Media contribution | What share of the modeled sales did current media create? | Whether the spend was efficient or should change |
| Average iROAS | How much incremental sales did each euro of current spend create on average? | The return from the next euro |
| Marginal iROAS | What incremental return is expected from a small increase or decrease at current spend? | The total historical contribution of media |
Keep the definitions consistent. Media contribution may cover paid media only, or it may also include email, push notifications, and other owned channels. Total sales may mean ecommerce revenue, omnichannel revenue, gross merchandise value before returns, or contribution margin. A percentage without its numerator, denominator, time window, and channel scope is not decision-ready.
Baseline demand is not the same as unexplained sales, and it does not mean media never influenced those customers. It is the model's estimate of sales that would occur without the media activity represented in the chosen time horizon. Brand equity built by years of earlier advertising may sit in baseline unless the model explicitly estimates that longer-term effect.
When can a small media contribution be a healthy result?
A small contribution can be healthy when the business has strong baseline demand, invests a modest share of revenue in media, and earns returns above its financial hurdle. Mature brands and retailers can generate most sales through existing awareness, customer habits, store footprint, assortment, pricing, promotions, CRM, and recurring demand.
The result can also expose underinvestment. A company may spend 0.5% of sales on media, earn an average iROAS of 5, and still see only a 2.5% media contribution. The historical share is small because the input was small. If marginal returns remain attractive, the next decision may be to invest more, not to conclude that media is unimportant.
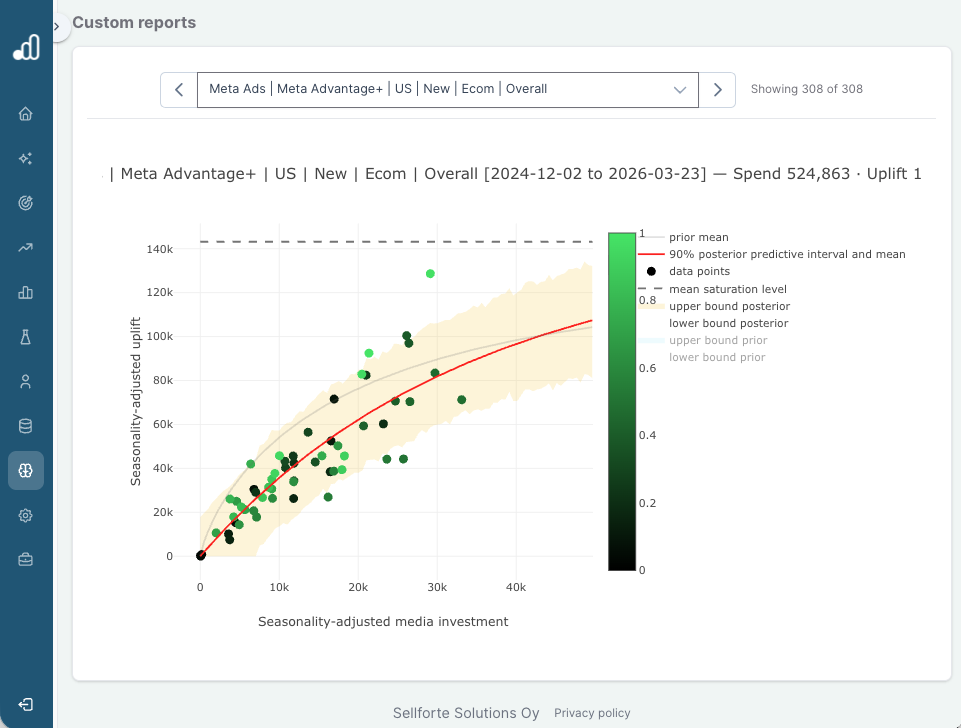
This is why advertising response curves matter. They show how incremental sales change as spend changes. A small current contribution with a steep curve and strong marginal iROAS points to headroom. The same contribution with a flat curve may show that the current channel mix is saturated.
Contribution can also fall while efficiency holds up. If media spend decreases by 20% and iROAS remains stable, the amount and share of media-driven sales should normally fall. That is a consequence of lower investment, not proof that the model or marketing became worse.
What can make the media share look too small?
The share can look too small when the model measures a narrower outcome than the media strategy is designed to create. Before challenging the coefficient, check whether the business question and model scope match.
- The outcome is too narrow. A model of immediate ecommerce revenue can miss store sales, later purchases, leads, app installs, subscriptions, or customer lifetime value. For acquisition-heavy businesses, a separate lead model or a transparent Full iROAS view may be needed.
- The denominator is broader than the media's addressable scope. A local channel may influence one market, category, customer group, or sales channel while the reported percentage uses total company sales.
- Owned and paid media are mixed. Email or CRM can represent a meaningful sales driver while paid media accounts for only a small part of the combined marketing total. Report the split clearly.
- Important demand drivers are missing or poorly modeled. Promotions, pricing, assortment, distribution, holidays, weather, and competitor activity can move with media. If the model omits them, their effect can be shifted into media or baseline. In retail, the treatment of promotions in MMM deserves particular attention.
- The evidence is weak or stale. Limited spend variation, overlapping channels, an old calibration study, or borrowed priors can leave the media estimate uncertain even when the dashboard shows one number.
None of these checks is a reason to push the result upward until it feels comfortable. They are reasons to make the scope explicit, inspect the evidence, and rerun the comparison on a like-for-like basis.
When should a small media contribution worry you?
A small contribution becomes a warning when it is paired with weak economics, a material scope or data problem, or evidence that the result is unstable. The percentage alone is not enough.
| Pattern | Likely interpretation | Next action |
|---|---|---|
| Small contribution, strong average and marginal iROAS | The business may be investing little relative to its revenue and still have room to scale | Test feasible budget increases and channel reallocation |
| Small contribution, healthy average iROAS, weak marginal iROAS | Existing spend worked, but additional spend may face saturation | Hold or reallocate rather than scaling the saturated channel |
| Small contribution, iROAS below the financial hurdle | The current investment may not create enough incremental value | Reduce, redesign, or move spend after checking uncertainty and scope |
| Small contribution, large uncertainty or conflict with experiments | The result may not yet support a material budget decision | Audit mappings and controls, then recalibrate or test |
Start by reconciling the sales outcome, spend, geography, channel taxonomy, and time window. Then inspect model fit, out-of-sample error, coefficient uncertainty, priors, and response curves. A high R-squared does not prove that the media split is causal, as Sellforte's guide to R-squared in MMM explains.
Compare the contribution and iROAS with business knowledge and independent causal evidence as well. Well-scoped incrementality tests can validate important channels or supply calibration evidence, provided the experiment and model measure the same campaigns, market, outcome, and period. Treat disagreement as a diagnostic signal, not as a reason to automatically choose the larger number.
Market and time-period comparisons can reveal what one total cannot. If two similar markets have very different contribution shares, decompose the gap into investment intensity, channel mix, iROAS, promotions, and model scope. If contribution changes year over year, show how much came from spend, efficiency, and the total-sales denominator. That makes the result explainable without pretending every market should have the same percentage.
How this looks in practice
Consider a hypothetical omnichannel retailer with $5 billion in annual sales and $50 million in paid-media spend. The MMM estimates an average paid-media iROAS of 3.0, so media creates $150 million in incremental sales. Paid media drives only 3% of total sales, but each dollar of spend still creates three dollars of incremental revenue.
| Sales driver | Incremental or base sales | Share of total sales |
|---|---|---|
| Baseline demand | $3,600M | 72% |
| Promotions | $750M | 15% |
| CRM and owned media | $300M | 6% |
| Paid media | $150M | 3% |
| Other modeled drivers | $200M | 4% |
The decomposition does not yet tell the retailer whether to spend more. The next view shows that paid social has a marginal iROAS of 3.4, generic search has 2.6, and branded search has 1.2. If the retailer's revenue hurdle is 2.0, the model supports moving some budget from branded search to paid social or generic search. The total paid-media contribution can remain close to 3% while the same $50 million produces more incremental sales.
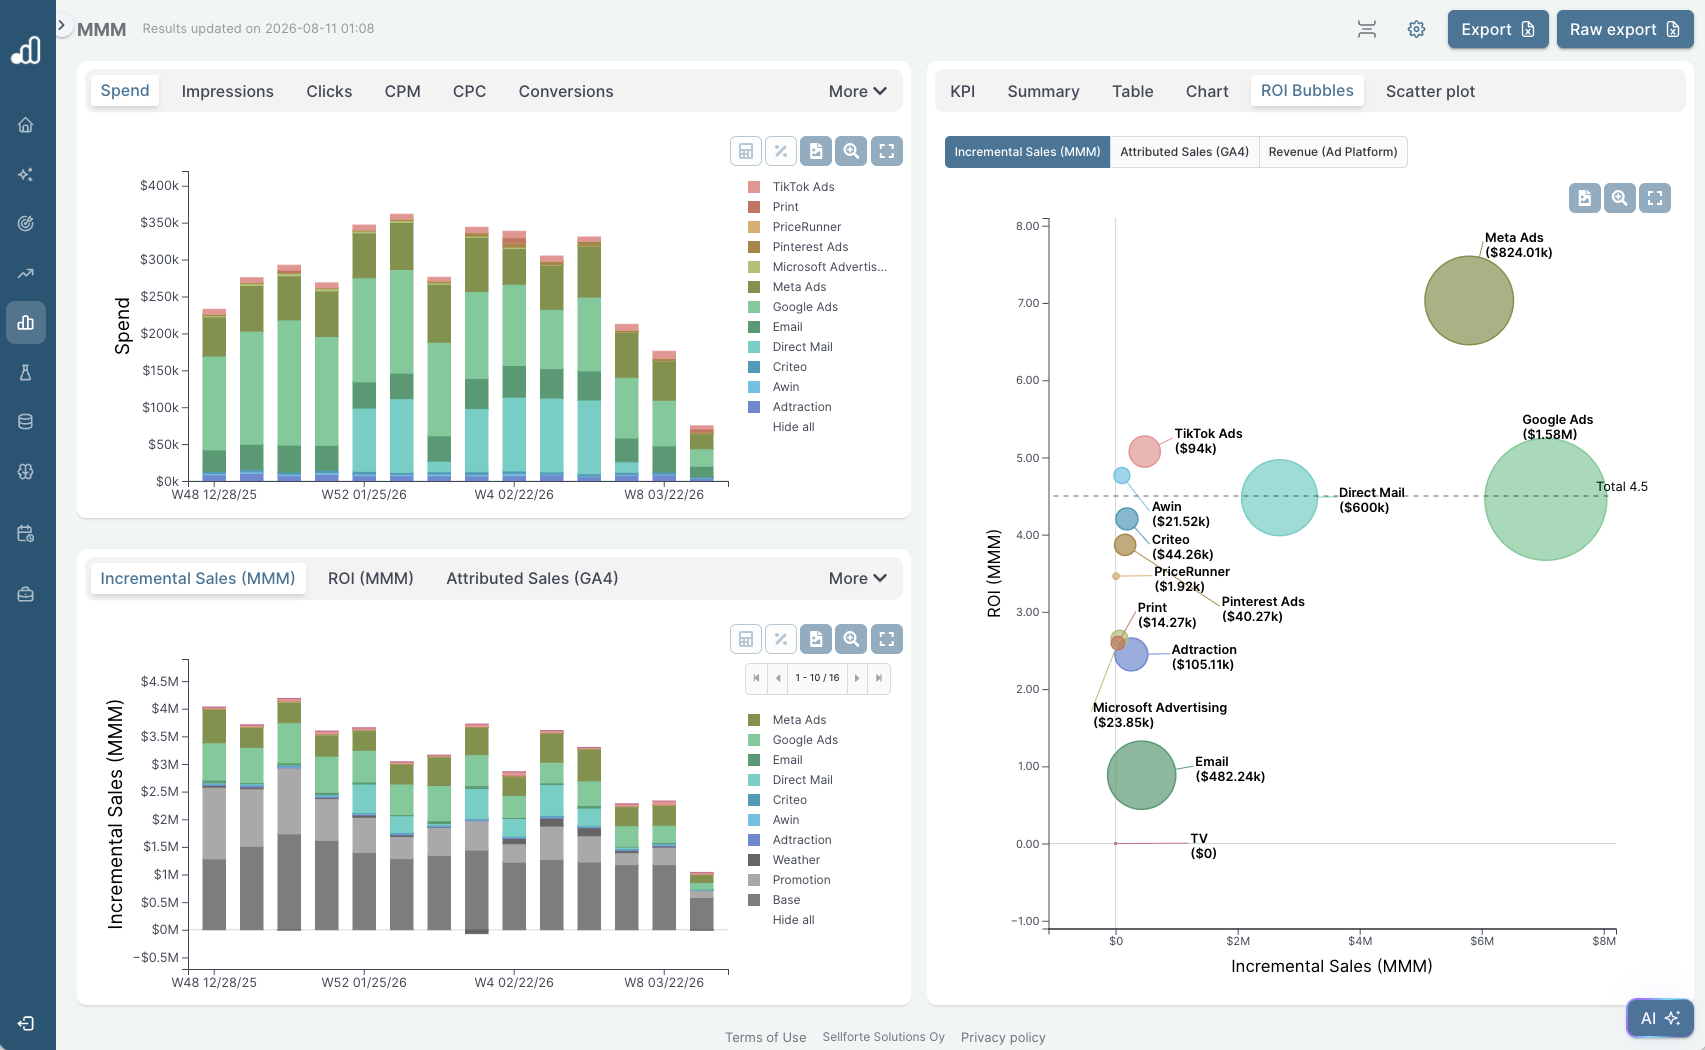
Now suppose the outcome audit finds that 40% of media spend targets app installs and leads, while the current model covers only immediate sales. The 3% contribution is then a valid answer to a narrower question, not the full value of media. The team should keep the immediate-sales result, add the incremental value of leads with an explicit time horizon, and avoid counting later revenue twice.
The final decision comes from the response curves. Historical contribution tells the retailer what the current plan produced. The curves show which channels have room to grow and which are close to saturation.
Related questions
Does a small media contribution mean the budget should be cut?
No. Cut or increase the budget based on marginal incremental return, financial thresholds, uncertainty, and feasible alternatives. A small contribution with strong marginal iROAS can justify more investment, while a larger contribution with weak marginal iROAS can justify a cut.
Why can platform ROAS look high when MMM says media's share is small?
Platforms credit conversions observed after ad interactions, including sales that may have happened anyway. MMM estimates the incremental sales caused by media against a counterfactual and reconciles the result with total sales. The platform number can be useful for execution, but it should not be read as media's share of company sales.
How often should media contribution be rechecked?
Recheck it whenever fresh sales and media data arrive, with automated stability checks and periodic review of calibration evidence. Contribution can change with spend, promotions, demand, campaign mix, and the sales denominator. See How often should you retrain your Marketing Mix Model (MMM)?
How can incrementality tests validate a surprising MMM contribution?
Use a test that matches the model feature on market, channel, campaign objective, KPI, and time period, then compare both the point estimate and uncertainty. A gap may be legitimate when the scopes differ, or it may reveal a mapping or calibration problem. See Why can a calibrated MMM show a different incremental ROAS than a conversion-lift study?
How Sellforte helps
Sellforte connects sales decomposition, channel iROAS, response curves, incrementality evidence, and media optimization in one workflow. Teams can explain why media's current contribution is large or small, audit the evidence behind it, and model the value of the next budget change. Book a demo.
Authors

Lauri Potka is the Chief Operating Officer at Sellforte and has over 15 years of experience in Marketing Mix Modeling, marketing measurement, and media spend optimization. Before joining Sellforte, he worked as a management consultant at the Boston Consulting Group, advising some of the world's largest advertisers on data-driven marketing optimization. Follow Lauri on LinkedIn, where he is one of the leading voices in MMM and marketing measurement.

How should we cut our marketing budget while protecting growth?

Should we run a full marketing blackout or a partial holdout test?