


Promotional lift is the increase in sales that a promotion causes: sales during the offer minus the baseline sales the same products, stores or channels would have made without it in the same period. It is reported in units, revenue or as a percentage of baseline, and only the net lift after cannibalization and pull-forward is truly incremental.
Promotional lift formula
Promotional lift = Sales with the promotion − Baseline sales
Promotional lift (%) = Promotional lift / Baseline sales × 100
- Sales with the promotion: actual sales of the promoted scope (products, stores, channels, customers) during the promotion window.
- Baseline sales: the estimated sales of the same scope in the same window if the promotion had not run. The baseline is a counterfactual, so it is never observed and always has to be estimated.
The term is also written as promo lift, promotion uplift or the promotion bump. Retail promotion evaluation has worked this way for decades: Abraham and Lodish (1993) described an implemented system that measures the short-term incremental volume of promotions by estimating baselines of "normal" store-level sales. For the full walkthrough of promotion economics, from baseline to contribution profit, see Promotion Analysis: How to Measure Incremental Sales and Profit.
Example calculation
A retailer runs a one-week 25% discount on a product with a regular price of 40 EUR and a unit cost of 24 EUR. Without the offer, it expects to sell 2 000 units that week. With the offer, it sells 3 200 units (illustrative numbers):
| Baseline (no promotion) | With 25% discount | Promotional lift | |
| Units sold | 2 000 | 3 200 | +1 200 (+60%) |
| Price per unit | 40 EUR | 30 EUR | −10 EUR |
| Revenue | 80 000 EUR | 96 000 EUR | +16 000 EUR (+20%) |
| Discount investment (3 200 × 10 EUR) | 0 EUR | 32 000 EUR | |
| Gross margin per unit | 16 EUR | 6 EUR | −10 EUR |
| Gross profit | 32 000 EUR | 19 200 EUR | −12 800 EUR (−40%) |
A 60% unit lift becomes a 20% revenue lift and a 40% fall in gross profit. The 2 000 baseline units would have sold at full price anyway, so the 20 000 EUR of discount on them buys nothing, while the 1 200 added units earn only 6 EUR each, or 7 200 EUR in total. To keep gross profit at 32 000 EUR, the offer would need to sell about 5 333 units, a unit lift of roughly 167%. Divided by the 32 000 EUR discount investment, the 16 000 EUR of incremental revenue gives an incremental ROAS (iROAS) of 0.5.
The example also assumes that every added unit is new demand. In practice, part of it usually is not.
Gross lift vs net promotional lift
The sales bump on the promoted item is the gross lift. The net lift for the business is smaller when the extra units come from elsewhere:
- Switching and cannibalization. Shoppers move from other products, including the seller's own full-price substitutes, to the promoted one.
- Purchase acceleration and stockpiling. Customers buy earlier or buy more, and then buy less after the offer ends. Advertised sales can also make customers wait, so sales dip before the promotion too.
- Category expansion and halo. Some of the bump is genuinely new consumption, and a promotion can bring in shoppers who also buy unpromoted products.
How large each part is depends on the category, the data and the method. In an early household-level study of ground coffee, Gupta (1988) attributed more than 84% of the promotional sales increase to brand switching, under 14% to purchase acceleration and under 2% to stockpiling. Using store-level data, Van Heerde, Leeflang and Wittink (2004) found that cross-brand, cross-period and category-expansion effects each contributed about one third of the bump on average across four datasets. For a retailer, switching between brands in the same store is not incremental at all: analyzing all of CVS's promotions in 2003, Ailawadi et al. (2006) found that about 45% of the gross lift was incremental to the retailer, that promotions had a positive halo on other categories, and that the average net profit impact was negative because the promotional margin was often much lower than the regular margin.
How promotional lift is estimated
The hard part is the baseline. Comparing the promotion week with the previous week or the same week last year attributes every other change in demand, such as paydays, holidays, weather, stock availability or advertising, to the offer. Three approaches give a more credible estimate:
- Controlled tests. Run the offer in some stores, regions or customer groups and keep a holdout group without it. Comparing the change in both groups over time, for example with difference-in-differences, removes trends that affect both.
- Baseline models. Time-series models of normal sales that adjust for seasonality, holidays and price, the approach behind store-level promotion evaluation systems.
- Marketing mix modeling. Promotions are estimated together with media, price, seasonality and other drivers, so each gets its own share of total sales.
Whatever the method, the evaluation window should run past the promotion end date, so that pull-forward shows up as a post-promotion dip rather than being ignored, and the scope should be wide enough to catch cannibalization of related products.
Promotional lift in marketing mix modeling
Promotions and advertising usually run at the same time, because the offer is what the ads communicate. If a marketing mix model leaves promotions out, their lift is credited to the media that ran alongside them. In Sellforte's analysis of 15 ecommerce and DTC brands, promotions drove on average 24% of revenue, and promotion-driven revenue correlated most strongly with bottom-of-funnel media spend (median correlation 0.71), which is why an MMM without promotions behaves like last-click and overstates the iROAS of conversion-focused campaigns. Including promotions also keeps base sales from absorbing the bumps around recurring sale events.
Open-source MMMs make the same distinction. Google's Meridian treats running a promotion or the price of a product as a non-media treatment variable: something the advertiser can intervene on, so the model estimates its causal effect, unlike control variables, and without the adstock and diminishing-returns (Hill) effects used for media (Google, n.d.).
The chart below from the Sellforte demo (demo data) shows weekly sales split into base sales, media-driven sales and the modeled lift of four promotion types. Black Friday and Cyber Week promotions add the largest weekly lift in late November 2025, and seasonal sales add visible bumps in early summer 2026.
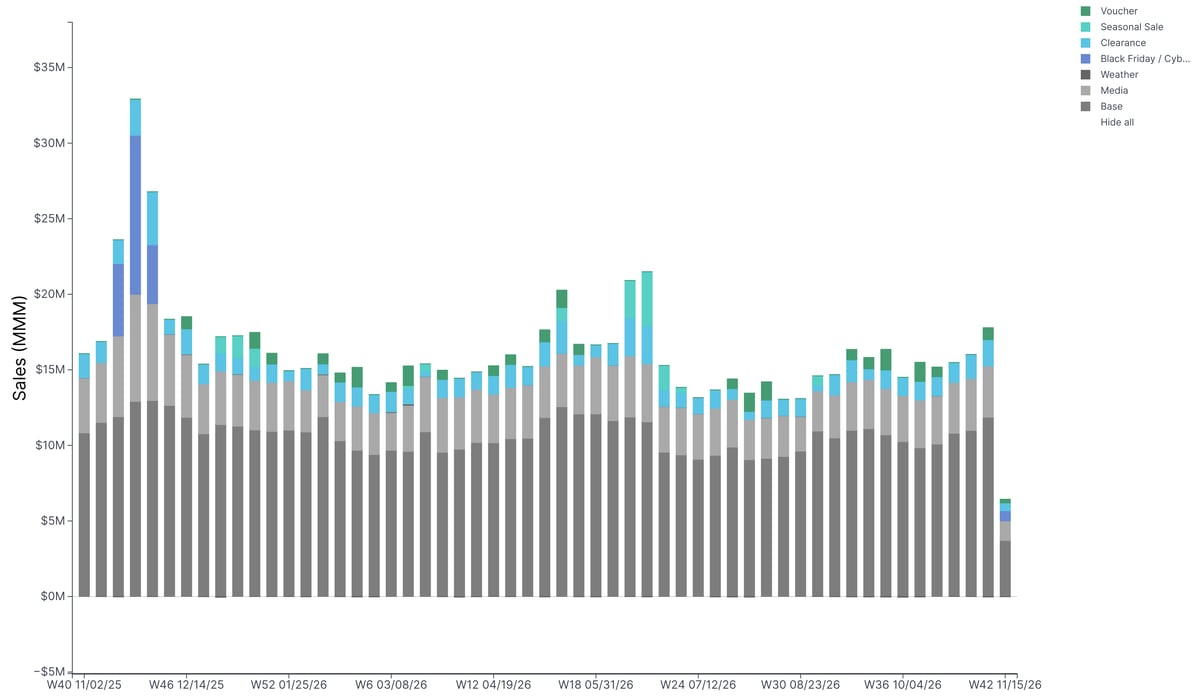
Over the same twelve months, the demo's promotions produce 124.7 million USD of modeled incremental sales on 111.4 million USD of discount investment, an iROAS of 1.12. Clearance (1.36) and Black Friday and Cyber Week (1.28) return more incremental sales per dollar of discount than seasonal sales (0.89) and vouchers (0.72). As the example above shows, a ratio above 1 still does not prove the promotion was profitable: that depends on margins, and promotions with clearance or customer acquisition goals are judged against those goals.
Key takeaways
- Promotional lift is sales with the promotion minus estimated baseline sales over the same scope and period, reported in units, revenue or percent.
- Unit lift, revenue lift and profit impact can point in different directions, because the discount also applies to sales that would have happened anyway.
- The gross bump includes switching, cannibalization and pull-forward. Net lift, estimated over a wide enough scope and window, is what matters to the business.
- Credible baselines come from controlled tests, baseline models or MMM. Leaving promotions out of an MMM inflates the iROAS of the media that ran with them.
Related terms
Further reading on Sellforte
- Promotion analysis: How to measure incremental sales and profit
- The missing 24%: Why MMM without promotions behaves like last-click
- The good, the bad and the ugly promotions
- How much of your Black Friday sales are marketing-driven?
References
- Abraham, M. M., & Lodish, L. M. (1993). An implemented system for improving promotion productivity using store scanner data. Marketing Science, 12(3), 248–269. https://doi.org/10.1287/mksc.12.3.248
- Ailawadi, K. L., Harlam, B. A., César, J., & Trounce, D. (2006). Promotion profitability for a retailer: The role of promotion, brand, category, and store characteristics. Journal of Marketing Research, 43(4), 518–535. https://doi.org/10.1509/jmkr.43.4.518
- Google. (n.d.). Organic media and non-media treatment variables. Meridian documentation. Retrieved 2026-11-22, from https://developers.google.com/meridian/docs/advanced-modeling/organic-and-non-media-variables
- Gupta, S. (1988). Impact of sales promotions on when, what, and how much to buy. Journal of Marketing Research, 25(4), 342–355. https://doi.org/10.1177/002224378802500402
- Van Heerde, H. J., Leeflang, P. S. H., & Wittink, D. R. (2004). Decomposing the sales promotion bump with store data. Marketing Science, 23(3), 317–334. https://doi.org/10.1287/mksc.1040.0061
Authors

Lauri Potka is the Chief Operating Officer at Sellforte, with over 15 years of experience in Marketing Mix Modeling, marketing measurement, and media spend optimization. Before joining Sellforte, he worked as a management consultant at the Boston Consulting Group, advising some of the world’s largest advertisers on data-driven marketing optimization. Follow Lauri in LinkedIn, where he is one of the leading voices in MMM and marketing measurement.


