

Context: A senior marketing analytics leader at a large omnichannel retailer needed to capture the sales halo from digital media to physical stores even though online exposure and store purchases could not always be linked at the customer level.
The short answer
MMM measures digital advertising's impact on offline store sales by modeling store revenue or transactions against media exposure over time and across geographies, while controlling for promotions, pricing, seasonality, weather, store footprint, and baseline demand. Loyalty or attribution data can enrich the model, and geo-lift experiments can calibrate the causal effect.
This article is part of Asked by Marketers, a series answering real questions from marketing leaders.
Sellforte's team holds more than 1,450 meetings each year with marketing leaders in Ecommerce and Retail about Marketing Mix Modeling and incrementality testing. Each week, we anonymize at least one question from those conversations and answer it in depth, based on what marketers are actually struggling with, not what keyword tools suggest. About the series →
Why do marketers ask this?
Digital reporting is usually built around what happens online. An ad platform can record clicks and platform-observed conversions. Web analytics can show ecommerce sessions and orders. Neither view naturally captures the shopper who researches online, visits a store, and buys there without a usable identity match.
That gap matters when physical stores account for a large share of revenue. A campaign can look weak in an ecommerce-only dashboard while generating valuable store demand. If the team optimizes against the smaller outcome, it may cut media that is working and favor channels that are simply easier to track.
Customer-level matching can help, especially when loyalty data connects ad exposure, site behavior, and purchases. It is rarely complete enough to be the only measurement method. Consent, platform boundaries, unmatched shoppers, household purchases, and data-sovereignty requirements all leave part of the journey unseen. The practical question is not how to reconstruct every journey. It is how to estimate the incremental store outcome credibly despite those gaps.
What data does MMM need to measure store sales?
Start with the outcome the business wants to improve. If the question is about offline store sales, store revenue, margin, transactions, or units must be a modeled KPI from the beginning. Footfall can be useful as a secondary outcome, but it does not answer the sales-impact question on its own.
For Marketing Mix Modeling, the most useful setup aligns the following inputs by a shared time and geographic grain:
| Input | Useful detail | Why it matters |
|---|---|---|
| Store outcomes | Revenue, margin, transactions, or units by day or week and by store, postal area, or sales area | Makes offline sales the target rather than an inferred side effect |
| Digital media | Spend, impressions, clicks, conversions, conversion value, campaign classifications, dates, and geographic delivery where available | Shows when and where advertising pressure changed |
| Retail demand drivers | Prices, promotions, holidays, weather, assortment, stock availability, store openings, offline media, and CRM activity | Stops obvious non-media changes from being credited to digital advertising |
| Supporting evidence | Loyalty matches, attributed offline conversions, geo-lift results, and conversion-lift studies | Adds granular signals and causal anchors without requiring complete journey tracking |
Order-level sales data is helpful because it can be consistently classified by sales channel, location, product category, and promotion. The model itself does not need names, email addresses, or individual paths. The records can be aggregated to a privacy-safe modeling level.
The right geography is usually larger than one store. Individual locations may not have enough sales or media variation to separate signal from noise, and shoppers often cross store catchment areas. A sales area, city cluster, postal region, or designated market area can be a better unit if it matches how the retailer already plans media and reports performance.
How does MMM estimate the offline sales impact?
Model ecommerce and store sales separately, then combine their incremental contributions for the omnichannel budget decision. The same digital campaign can enter both models, but its estimated effect does not have to be the same. Paid search may lean toward ecommerce, while video or paid social may produce a larger store share in a particular business.
The model first establishes the sales pattern it would expect from baseline demand and the observed non-media drivers. It then estimates whether changes in digital advertising are followed by additional store sales after those other factors are accounted for. Time lags matter because store visits can occur days after exposure. Diminishing returns matter because the next dollar at a high spend level may produce less than the first. These relationships are represented through carryover assumptions and advertising response curves.
Geographic variation makes the estimate stronger. If media pressure differs across otherwise comparable sales areas, the model can compare how store outcomes move with that variation. Nationwide campaigns can still be modeled through changes over time, but geography supplies another useful source of identification.
Loyalty and attribution signals can improve granularity. For example, matched offline conversions may help allocate a channel-level store effect across campaigns. They should not silently define the total effect unless the matched shoppers represent the full customer base. The MMM remains responsible for estimating the business-wide outcome.
How do experiments strengthen the estimate?
A geo-lift experiment is the most direct way to test the same offline outcome without relying on complete user-level linkage. The retailer changes digital media pressure in selected regions, builds a credible control from untreated regions, and compares actual store sales with the counterfactual. The experiment should use the same KPI definition and include a suitable post-treatment period.
That result becomes a calibration anchor for the MMM. If the geo-lift estimate and the model agree within their uncertainty, confidence improves. If they disagree, inspect the campaign mapping, geographic spillover, promotions, sales coverage, spend level, and time window before changing the model. Incrementality testing adds causal evidence, but one experiment still describes a specific intervention in a specific period.
Platform conversion-lift studies can also help when store purchases are passed back through a reliable offline-conversion match. Their scope is narrower: they cover eligible users, selected campaigns, the platform's identity graph, and the supplied conversion definition. Use them as granular evidence, not as proof that all store sales effects are observed.
What can make an offline sales estimate unreliable?
The most common failure is training the model only on ecommerce revenue and then treating the result as total sales impact. No statistical sophistication can recover an offline outcome that was never included.
Several retail events can create a false media signal. A national promotion can coincide with a digital campaign. A store opening can change local sales capacity. Stockouts can suppress observed demand. Media delivery can spill across regional boundaries, and shoppers can buy outside the area where they live. A model that ignores these changes may move their effect into the digital estimate.
Granularity can also outrun the data. A retailer may want a daily estimate for every campaign, product category, and store, but many of those cells will have too little variation to support a stable result. Start at the most decision-useful level the data can sustain. Add detail when the campaign mapping, sales volume, and calibration evidence justify it.
MMM answers an aggregate incremental question under explicit modeling assumptions. It estimates how much store sales changed because digital advertising changed. It does not reveal the complete path of each shopper, and it should not be presented as if it does.
How this looks in practice: Example
Consider a hypothetical omnichannel retailer running a six-week YouTube reach campaign. The campaign spends $200,000. The ad platform reports a ROAS of 0.6 from conversions it can observe. Web analytics reports 0.2.
The retailer's MMM models ecommerce and store sales separately. It includes promotions, holidays, weather, store-network changes, other media, and baseline demand. The model estimates $1,000,000 in total incremental sales, or an iROAS of 5.0. In this example, 30% of the modeled uplift comes from ecommerce and 70% from stores.
| View | Result | What it includes |
|---|---|---|
| Ad platform ROAS | ROAS 0.6 | Conversions observed and attributed by the platform |
| MMM iROAS | iROAS 5.0 | Full incremental sales impact |
| MMM ecommerce contribution | $300,000 | Modeled incremental ecommerce sales |
| MMM store contribution | $700,000 | Modeled incremental physical-store sales |
| MMM omnichannel total | $1,000,000 | Ecommerce and store effects combined |
An ecommerce-only reading would miss most of the modeled uplift in this example. That does not make the MMM point estimate automatically correct. The team should use the uncertainty interval, inspect the model fit by sales area, and compare the result with a geo-lift test before making a large budget move.
How this looks in practice: Research
Sellforte's analysis of 96 Marketing Mix Models from different retail industries found that the offline share of paid social's full incremental sales impact varied by campaign type. Physical stores accounted for 55% of the impact from paid social awareness campaigns, 37% from paid social performance campaigns, and 41% from Meta Advantage+.
| Paid social activity | Offline share of full incremental sales impact | Multiplier from incremental ecommerce sales to full sales impact |
|---|---|---|
| Paid social awareness | 55% | 2.2x |
| Paid social performance | 37% | 1.6x |
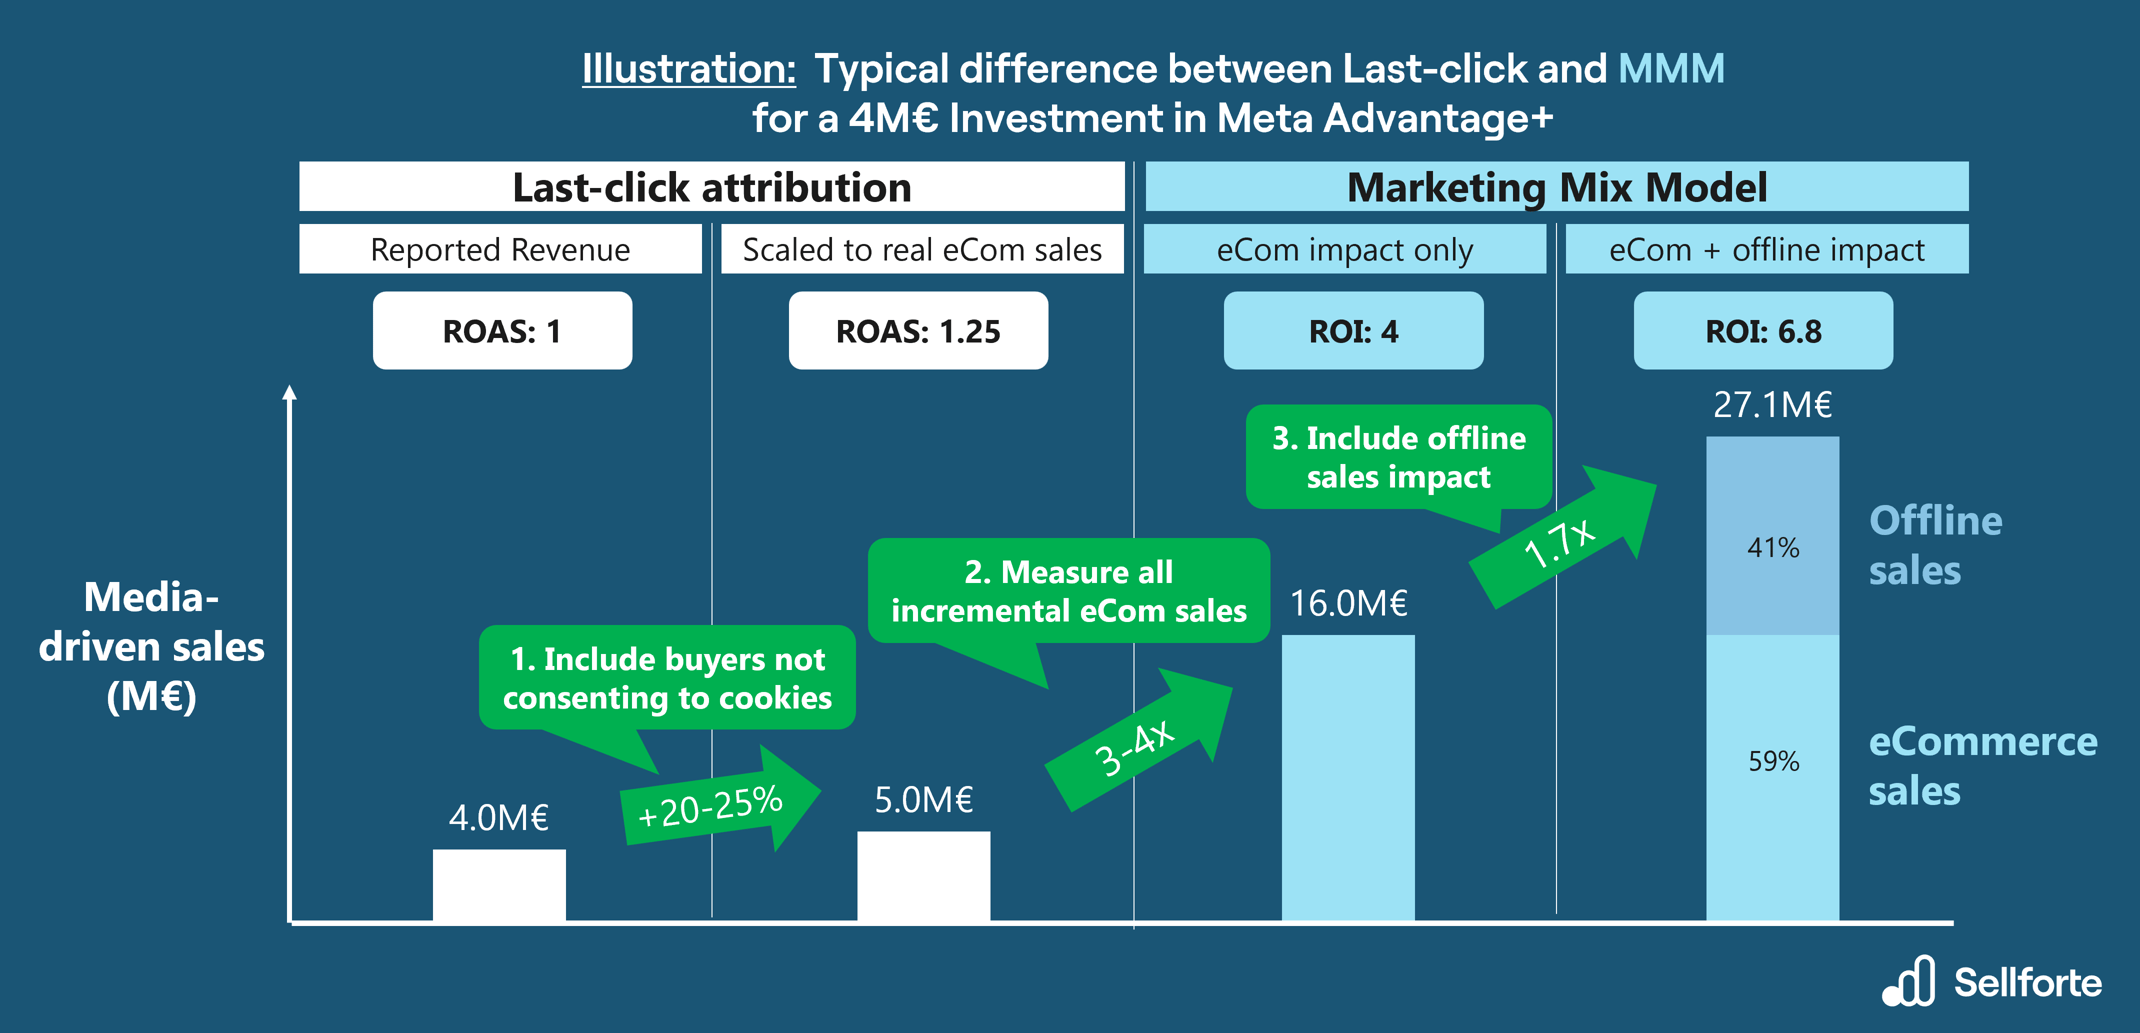
| Meta Advantage+ | 41% | 1.7x |
The 1.7x figure needs a precise starting point. It applies to the incremental ecommerce sales that MMM has already attributed to Meta Advantage+, not directly to raw platform-reported revenue. In the research illustration, a €4 million investment first appears to generate €4 million in last-click revenue. After correcting for unobserved ecommerce sales and measuring incrementality with MMM, the ecommerce contribution is €16 million. Adding the typical offline share brings the full modeled sales impact to €27.1 million, or an ROI of 6.8.
These averages are benchmarks, not correction factors to apply mechanically. The store share tends to be larger for retailers whose business is more heavily weighted toward physical stores, and smaller for retailers with a larger ecommerce mix. Each retailer should estimate its own ecommerce and store contributions and validate material decisions with experiments.
Related questions
Does MMM need customer-level identity matching?
No. MMM can estimate aggregate sales response from variation across time and geography without identifying individual shoppers. Loyalty matches and offline-conversion feeds can add useful signals, but the method should still account for customers and purchases that those systems do not observe.
Should store and ecommerce sales be modeled separately?
Yes. Separate models show whether a channel drives different returns across sales channels and prevent a large store business from disappearing inside an ecommerce KPI. The contributions can then be combined for an omnichannel budget decision.
Can footfall replace store sales in the model?
Footfall is useful when the immediate question is whether advertising generates store visits. It should not replace sales or margin when the decision concerns financial return, because more visits do not always produce proportionate purchases. Model both when the two stages matter.
How do MMM, MTA, and incrementality testing work together?
Use incrementality tests for causal anchors, MMM for the business-wide view across ecommerce and stores, and attribution for granular campaign signals. The methods answer different parts of the decision and work best as one system. See When should an omnichannel retailer use MMM, MTA, or incrementality testing?.
How Sellforte helps
Sellforte models ecommerce and store outcomes separately, combines digital media with retail demand drivers, and connects geo-lift and conversion-lift evidence to MMM calibration. Teams can compare attributed and incremental results, see where sales occurred, and plan against the total business outcome rather than the easiest conversion to track. Book a demo.
Authors

Lauri Potka is the Chief Operating Officer at Sellforte and has over 15 years of experience in Marketing Mix Modeling, marketing measurement, and media spend optimization. Before joining Sellforte, he worked as a management consultant at the Boston Consulting Group, advising some of the world's largest advertisers on data-driven marketing optimization. Follow Lauri on LinkedIn, where he is one of the leading voices in MMM and marketing measurement.
.png)
What is Incrementality Testing? Guide for Marketers

When should an omnichannel retailer use MMM, MTA, or incrementality testing?