
Sellforte is a marketing measurement and optimization platform. It combines marketing mix modeling (MMM), incrementality testing and attribution data into one view of what your marketing really drives, and turns that view into budget and campaign decisions. Results are refreshed continuously as new data arrives, so what you see reflects your latest sales and media activity.
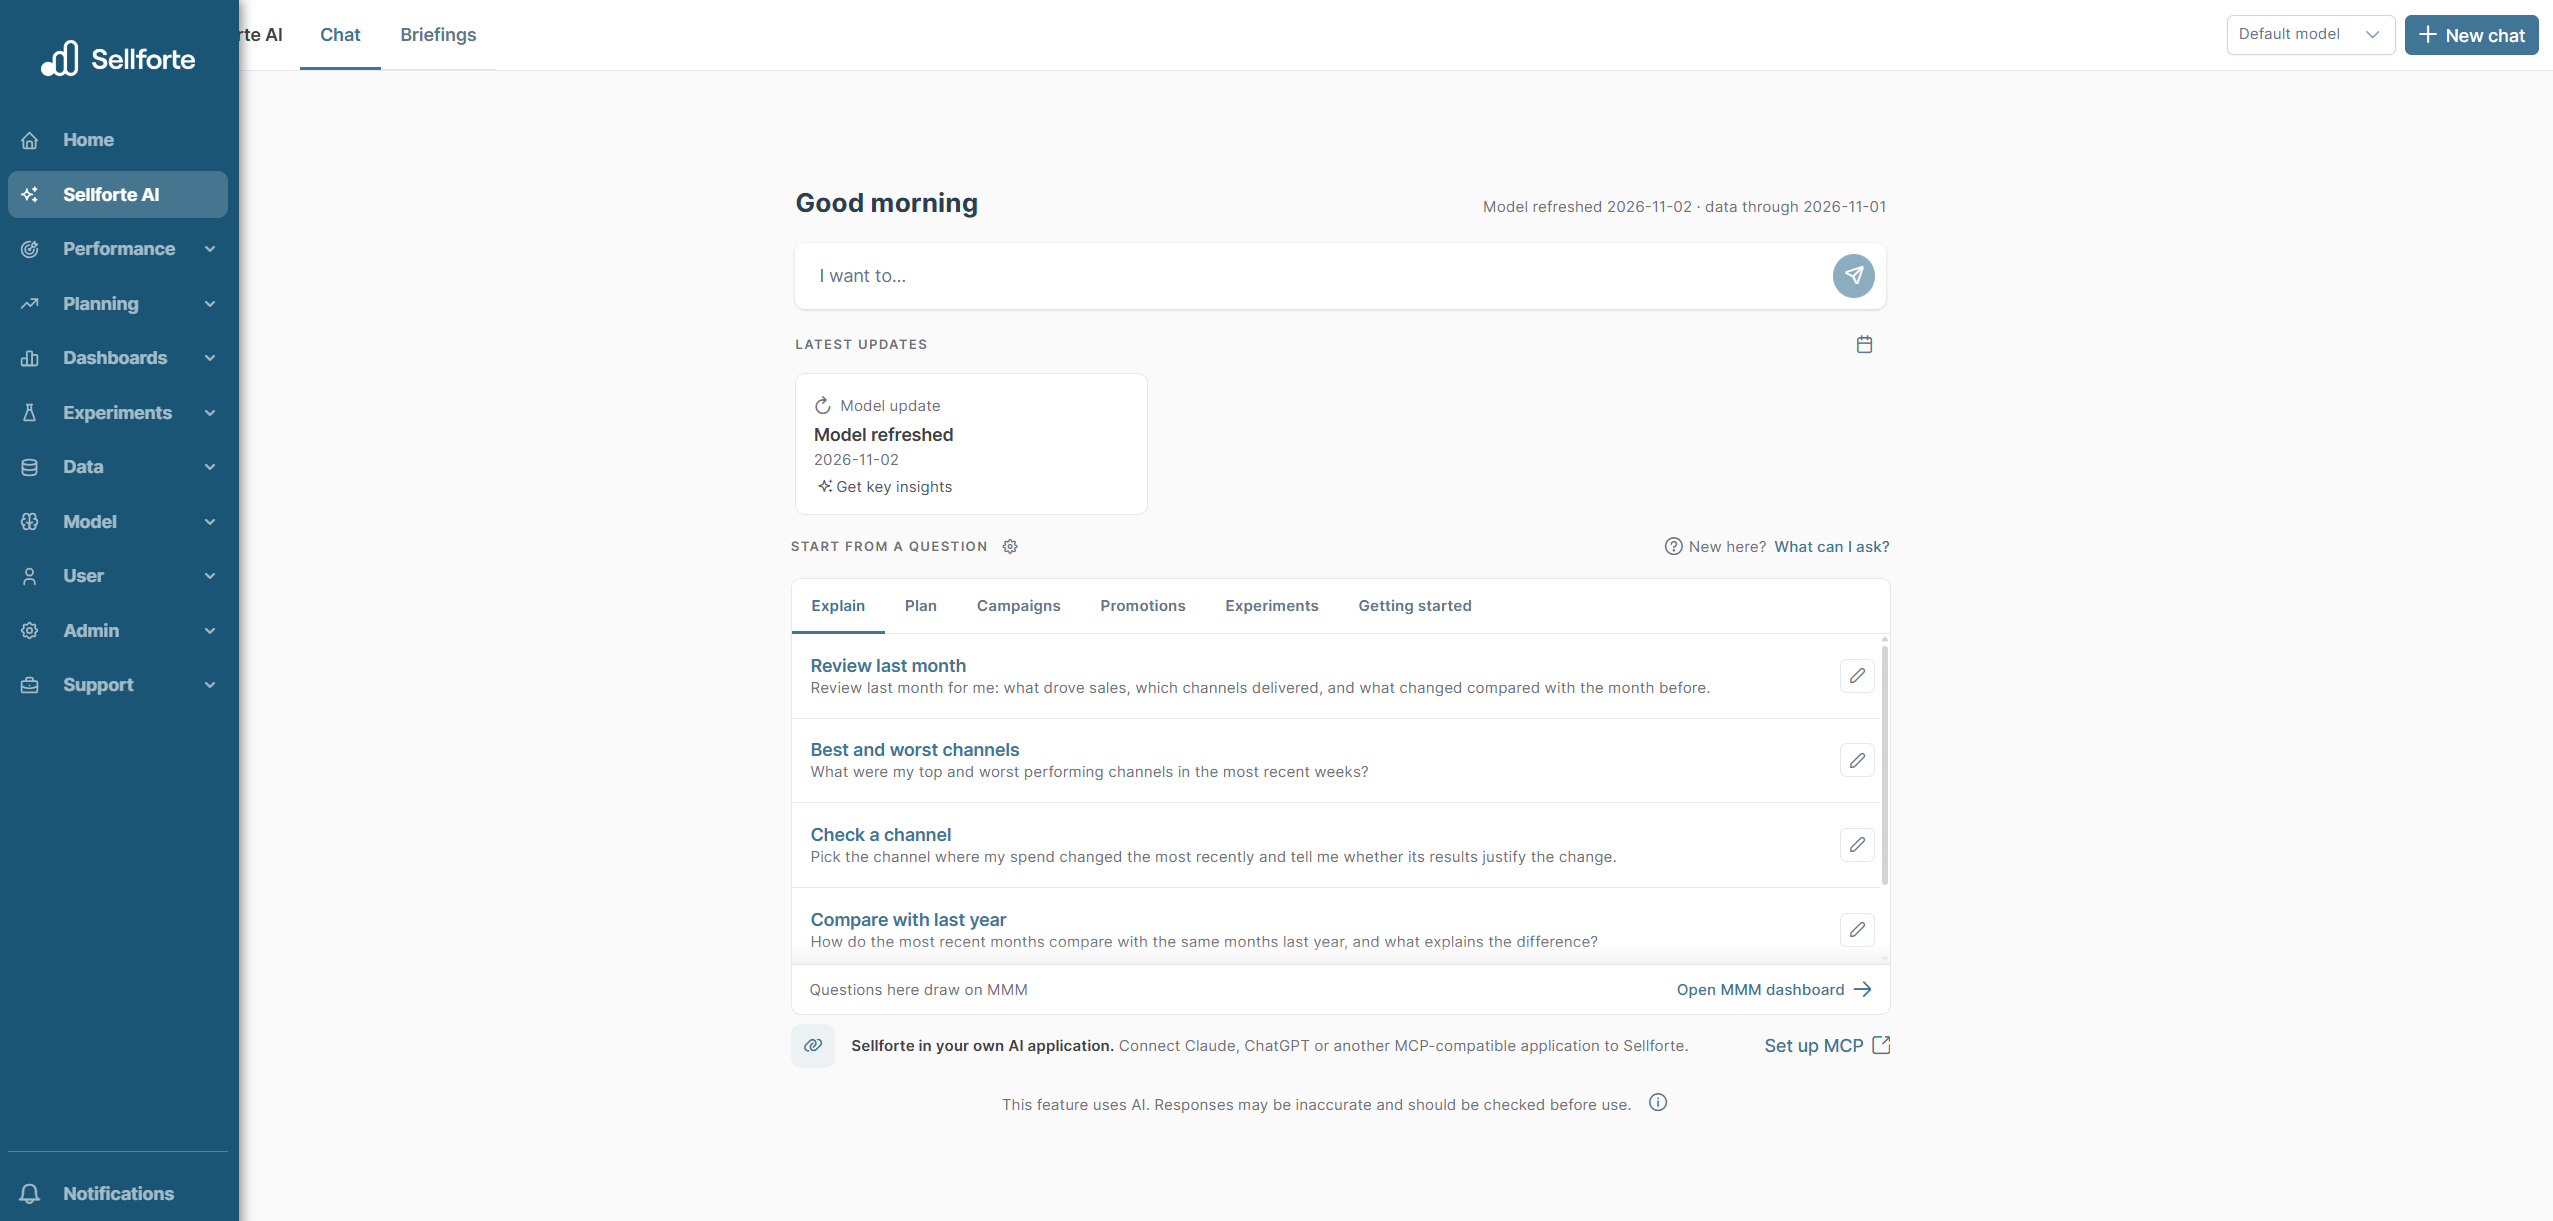
This article is a guided tour of the platform. It explains the ways you can work with Sellforte, then walks through the user interface section by section, in the same order as the navigation, and tells you which view to open for which question.
Three ways to work with Sellforte
- In the user interface. Dashboards, planning tools and campaign recommendations that you explore yourself. Most of this article covers the user interface.
- Through Sellforte AI and Sellforte MCP. Ask questions in plain language and get the answer as text, a table or a chart. Sellforte AI is the chat inside the platform. Sellforte MCP brings the same data into the AI assistant your team already uses, such as Claude, ChatGPT, Microsoft Copilot or Google Gemini.
- With your Customer Success Manager. Your CSM prepares analyses, walks you through results and helps turn them into decisions. Bring your questions to them whenever you want a second pair of eyes or a deeper analysis.
All three use the same data and the same model, so the numbers match wherever you look.
Find the right view for your question
| Your question | Where to go |
|---|---|
| What drove our sales last week, month or quarter? | Dashboards → MMM |
| Why do the modeled results differ from GA4 or the ad platforms? | Dashboards → MMM |
| Which promotions and discount levels pay off? | Dashboards → Promotions |
| How should we split next quarter's budget? | Planning → Media optimizer |
| What will the media plan we already built deliver? | Planning → Media plans |
| Which channels still have room to grow? | Planning → Response curves |
| Which campaigns should get more or less budget this week? | Performance → Recommendations |
| Did the change we made last week work? | Performance → Change Intelligence |
| What should we test next, and what have we learned from past tests? | Experiments |
| Is our data connected and up to date? | Data |
| How well does the model fit our actual sales? | Model → Validation |
| I just want a quick answer. | Sellforte AI → Chat |
The navigation on the left is grouped into seven sections. Depending on your setup, some views may not be visible in your environment. Your Customer Success Manager can tell you what is switched on.
Sellforte AI: ask instead of click
In short: a chat that answers questions about your marketing performance in plain language, using your own Sellforte data. Chat is the page you land on when you log in.
- Chat. Ask about performance, drivers of change or budget allocation, and continue with follow-up questions. Sellforte AI can also build Media optimizer scenarios for you and compare them. Good first prompts are "What changed in performance this month compared with last month?" and "Which channels are driving the biggest impact right now?".
- Briefings. Turn a question you ask regularly into a scheduled briefing. You write the prompt once, pick a daily, weekly or monthly schedule, and the answer arrives by email and in your chat history.
Use it when you want a fast answer without building a view, when you prepare for a meeting, or when colleagues who rarely open the platform need the numbers regularly.
Tip: get better answers. Be specific about the time period, market and metric, and ask one focused question at a time. If you prefer to work in your own AI assistant, connect Sellforte MCP and ask the same questions there. See Connecting Sellforte MCP to your LLM client.
Dashboards: understand what happened
In short: the look back. Dashboards show what drove your sales and how each channel, campaign and promotion performed.
MMM dashboard
The MMM dashboard is the heart of the platform and the best place to start. It brings your sales, your media data and the modeled results into one view.
- See what drove sales. The incremental sales chart splits total sales into base (sales you would get without marketing), media, promotions and weather. All media results are incremental, meaning sales that happened because of the marketing activity.
- Filter and group freely. Choose the time range and the granularity (day, week, month, quarter or year), then group by ad platform, advertising channel or campaign. You can filter by dimensions such as sales channel, market, brand or product category, and add a second grouping to see, for example, how each channel affects online and store sales.
- Compare periods. Compare against the previous period or last year to see what changed and why: base, media, promotions or weather.
- Compare measurement sources. Modeled incremental results sit side by side with the numbers GA4 and the ad platforms report, so you can see where they agree and where they differ.
- Switch the visualization. KPI boxes, time series charts, a table view and an ROI bubble chart that shows efficiency and investment size at a glance.
Use it when you report on marketing performance, explain a change in sales, or want to know which channels are efficient before planning the next period.
Good to know: why modeled results differ from GA4 and the ad platforms. The sources measure different things. GA4 and the ad platforms report the sales they can connect to a click or a view. The model estimates the sales that would not have happened without the marketing, including store sales and delayed effects. Brand search often looks strong in click-based reporting and lower in the model, while awareness campaigns often show the opposite. Read more in Why Sellforte's results can differ from what Google Ads, Meta Ads, and other platforms report.
Sales dashboard
The Sales dashboard shows your sales data as delivered, without modeling. Use it to review sales trends by dimensions such as product category or market, and to check that the sales data in Sellforte matches your own reporting.
Promotions dashboard
The Promotions dashboard works like the MMM dashboard but focuses on discounts. The discount you give is treated as the investment, and the dashboard shows the incremental sales and margin it generated. You can break results down by discount depth, promotion type and category.
Use it when you want to know which discount levels and promotion mechanics are worth repeating, and where deeper discounts stop paying off.
Planning: decide where the budget goes
In short: the look ahead. Planning tools forecast what a budget will deliver and find a better allocation across channels.
- Media optimizer. Build budget scenarios for a year, a quarter, a month or a single event such as Black Friday. A typical workflow is to create a reference scenario that repeats a past media mix, then an optimized scenario, and compare the two side by side. You can optimize a fixed budget, or set a sales or ROI target and let the optimizer calculate the budget needed. Spend ranges per channel keep the result realistic, and finished scenarios can be published for colleagues.
- Media plans. Upload the media plan you have already built, using a template that contains your own channels and markets. A saved plan can then be used as the starting point of a Media optimizer scenario, so you get a forecast of your actual plan and an optimized alternative to compare it against.
- Response curves. See how sales respond to spend for every channel. The curves show where a channel still has room to grow and where extra spend adds little. See Reading response curves.
Use it when you plan annual, quarterly or campaign budgets, need to show what a budget increase or cut would mean for sales, or want to check a media plan before committing to it.
Tip: combine the result with what you know. The optimizer works from the response curves in your model. It does not know about booking deadlines, contracts or strategic priorities, so set the spend ranges to reflect them and review the result with your team before acting on it.
Performance: steer campaigns day to day
In short: the tactical layer. Where Planning works at channel level over weeks and months, Performance works at campaign and ad set level, day by day.
- Recommendations. A list of suggested budget and bid changes for your campaigns and ad sets, with the expected change in spend and incremental sales. The suggestions are based on how much more each campaign can deliver for the next unit of spend.
- Insights. A flexible campaign and ad set level table for exploring past performance. Modeled incremental results sit next to the ad platform and GA4 numbers, and you can save your own column sets, for example one for paid social and one for paid search.
- Change Intelligence. Every change to a campaign budget or bid is evaluated afterwards against what would have happened without it. You see which changes worked, and that evidence feeds back into the next recommendations.
Use it when you manage campaigns weekly or daily and want your budget and bid decisions to follow incremental results.
Read more in Performance: Overview.
Experiments: test, learn and calibrate
In short: the place for incrementality tests. An experiment measures the causal effect of one specific activity, and the result makes your model stronger.
- Overview. Your experiment library. Analyze geo lift tests and A/B tests, and collect conversion lift studies from the ad platforms in one place, with results presented in the same format.
- Recommendations. A ranked list of what to test next. Each opportunity gets a priority score based on its impact on your media mix, the gaps in your existing test evidence, and how easy the test is to run.
- Calibration. Shows how your experiments are used as evidence in the model: which tests contribute to which channel, and how much weight each one carries. Newer and more precise tests carry more weight.
Use it when you want proof of a channel's incremental effect, plan your testing roadmap, or want to understand how a test result has influenced your modeled results.
Read more in Sellforte Experiments: Overview, Test Prioritizer: Overview and Calibrating your MMM with experiment results.
Data: connect, upload, visualize and monitor
In short: everything about the data behind your results.
- Status. Monitor your data sources and check that data is arriving and up to date.
- Connectors. Connect ad platforms, analytics tools, ecommerce platforms and data warehouses. Once a connector is set up, data is updated automatically.
- Data upload. Upload files for data that has no connector, such as offline media or other business data.
- Visualize. Look at the incoming data itself before it is used in the model, to confirm that it looks right.
Use it when you add a new data source, a number in a dashboard looks off and you want to check the input data, or a connection needs to be renewed.
Setup instructions for each source are in the Connecting Data section of this Support Center. Start with the Data Connector FAQ.
Model: check how far you can trust the results
In short: transparency into the model itself.
- Validation. Compare modeled sales with actual sales over time, and review fit metrics by market, brand or sales channel. A close match means the model reproduces your business well.
Use it when you want to judge how much weight to put on the results for a given market or brand, or when stakeholders ask how reliable the model is.
Read more in Understanding Model Validation.
A good first session
- Open Dashboards → MMM. Select the last full month and look at the split of sales into base, media, promotions and weather.
- Group by ad platform, then drill down. Find your largest channels and compare their modeled results with the GA4 and ad platform numbers.
- Compare with last year. See what changed and which driver explains it.
- Open Planning → Media optimizer. Create a reference scenario for the next quarter and an optimized one, and compare them.
- Open Performance → Recommendations. Review the suggested changes for the campaigns you manage.
- Ask Sellforte AI. Put the question you could not answer in the views to the chat.
Need help? Your Customer Success Manager can walk you through any view, prepare a deeper analysis, or set up a training session for your team.