
What you can report with Sellforte MCP
Sellforte MCP answers questions about your actual marketing data in plain language, inside Claude, ChatGPT or another Large Language Model. You ask, the MCP queries your Sellforte environment, and the answer comes back with the same figures you see in the Sellforte dashboard.
Below are examples of reporting areas Sellforte MCP can help with.
|
You can ask about |
Examples |
|---|---|
|
Sales |
Online sales, physical store sales, sales by brand, market or product category |
|
Digital media |
Spend, impressions, clicks, CPM, CPC and conversions across Meta, Google, TikTok and your other paid platforms |
|
Offline media |
Spend and media metrics for TV, out of home, radio, print and other offline channels |
|
Other business outcomes |
Any KPI configured in your Sellforte environment, such as orders, new customers or contribution margin |
|
Incremental impact |
Incremental revenue and ROI per channel and campaign, from the MMM rather than from last click |
|
Promotions |
Revenue and margin driven by promotions, separated from media driven revenue |
|
Drivers of a change |
The split of a KPI into base, media, promotions and other modeled drivers |
|
Any combination |
Filtered and grouped by date, brand, market, product, campaign and the other dimensions in your data model |
Before you start
You need Sellforte MCP connected to your LLM client. The steps, including the EU and US server URLs, are in Connecting Sellforte MCP to your LLM client.
Two things are worth knowing before you ask your first question:
- You see your own data only. The MCP session is tied to the Sellforte organization you selected when connecting, and it returns data in your environment's own currency and locale.
- Metrics and dimensions follow your data model. The MCP reads the available datasets, metrics, dimensions and date range from your environment before it answers, so the examples below use generic names. Ask "what data can you report on?" to see the exact labels in your own environment.
The MCP also reports when your results were last refreshed. Ask "when was the data last updated?" and you get the actual refresh timestamp, not an estimate.
Reporting sales or revenue
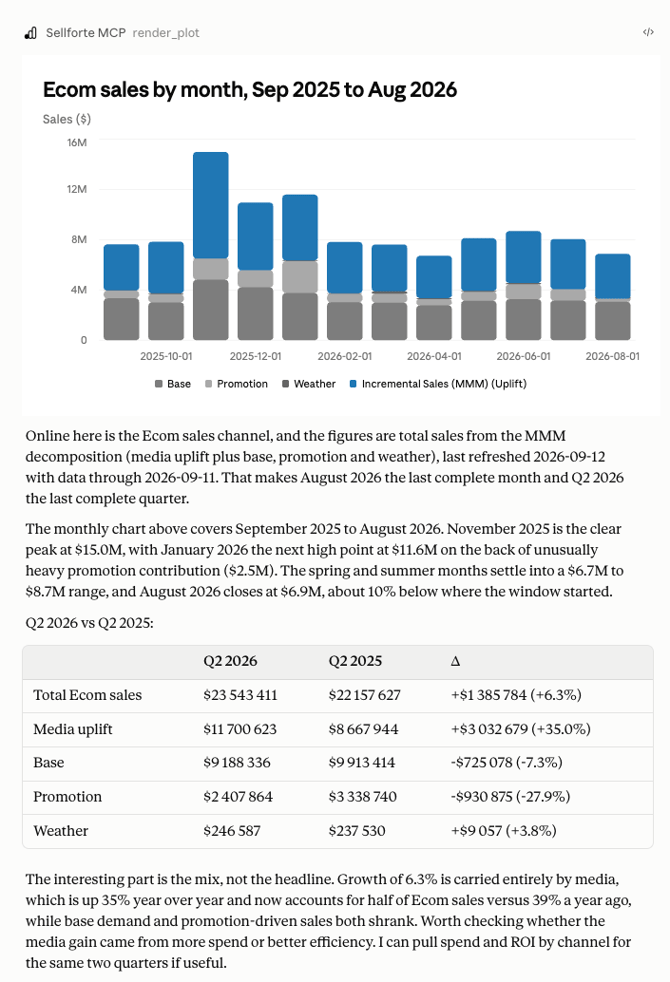
Ask for actual sales over any period covered by your data, and the MCP returns the total plus a breakdown by week, month, quarter or year. Add a comparison period and you get the change and the percentage change in the same answer.
Example prompt: "Using Sellforte Show our online sales by month for the last 12 months, and compare the last quarter to the same quarter last year."
Claude replying with Sellforte MCP:
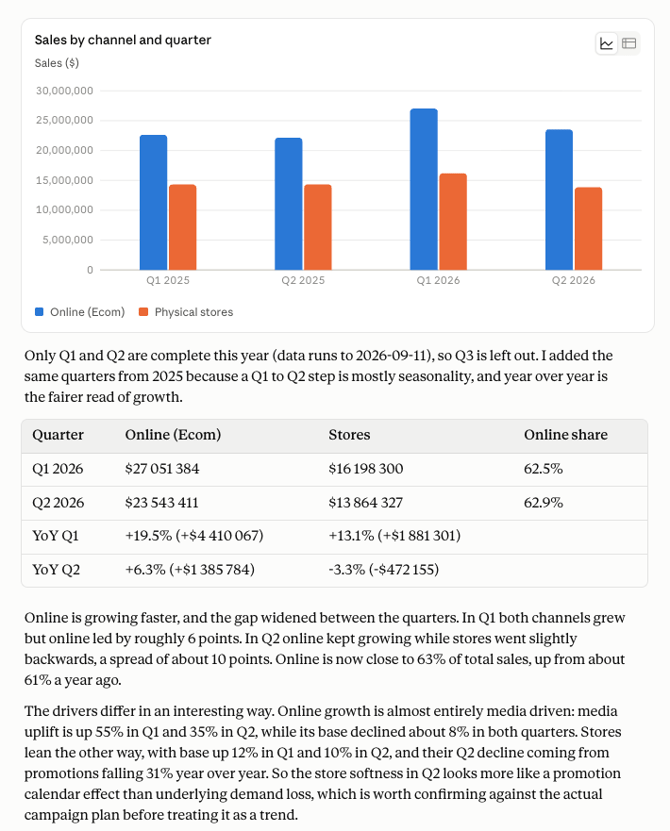
Store sales work exactly like online sales. When your offline sales data is delivered to Sellforte from your data warehouse, through a connector or over SFTP, the MCP reports it at the same granularity and with the same filters.
Example prompt: "Split our sales into online and physical stores by quarter this year, and tell me which one is growing faster."
Claude replying with Sellforte MCP:
Other example prompts:
- "How much did we sell online in August 2026?"
- "How did online sales in Q2 2026 compare to Q2 2025?"
- "Which product categories grew the most online this year?"
- "What were our store sales last month?"
- "Split total sales into online and store for each quarter this year."
- "Which store regions are below last year's level?"
Because online and store sales sit in the same model, you can ask for total company sales in one question and then drill into either channel without changing tools.
Reporting digital media data
The MCP reports spend and media metrics for every paid platform connected to Sellforte, including Meta, Google, TikTok, Amazon, Criteo and the rest of your connector setup. Metrics available on the media datasets typically include (your setup might be different):
|
Metric |
Definition |
|---|---|
|
Spend |
Media investment in your environment's currency |
|
Impressions |
Delivered impressions |
|
Clicks |
Delivered clicks |
|
CPM |
Spend divided by impressions, times 1 000 |
|
CPC |
Spend divided by clicks |
|
Conversions and conversion value |
Platform reported conversions and their value |
|
Conversion CPA |
Spend divided by conversions |
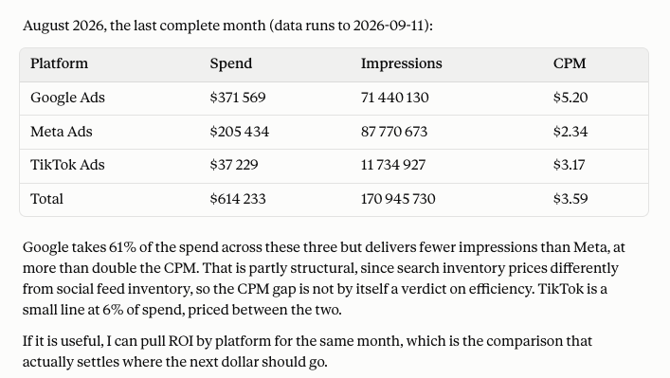
Example prompt: "How much did we spend on Meta, Google and TikTok last month, and what were the impressions and CPM for each?"
Claude replying with Sellforte MCP:
Other example prompts:
- "How much did we spend on Meta, Google and TikTok last month?"
- "Show weekly paid social spend and impressions since January."
- "What was our CPM by ad platform in Q2 2026?"
- "Which campaigns had the highest click volume in Germany last month?"
Spend is always reported in your environment's currency, and platform naming follows the campaign structure Sellforte ingests, so campaign and ad set names match what you see in the ad platforms.
Reporting offline media data
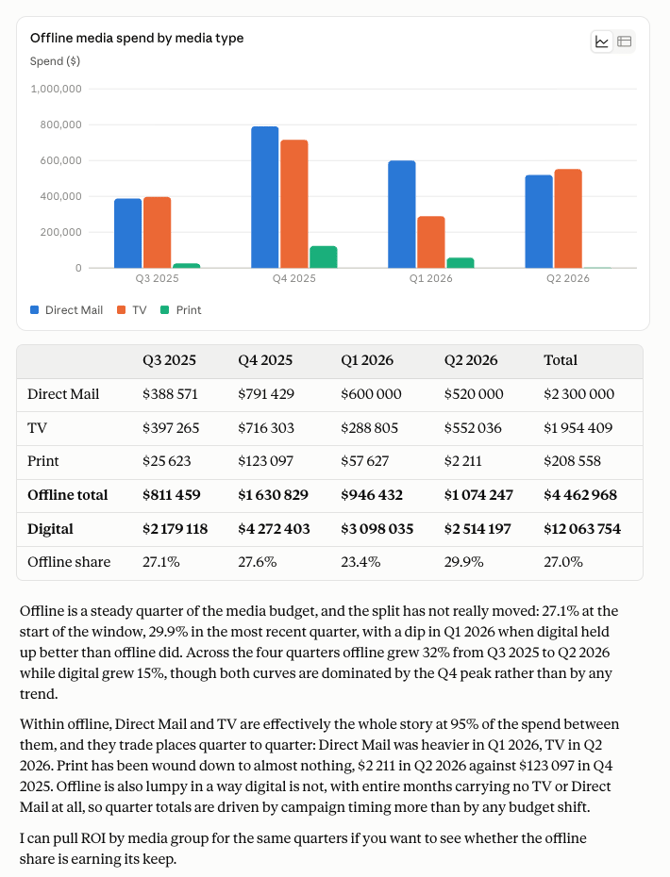
Offline media sits in the same media dataset as digital, so TV, out of home, radio, print, cinema, direct mail and leaflets are reported with the same metrics and the same prompts. Spend is always available. Media metrics such as impressions, contacts or gross rating points depend on what your agency or media owner delivers into Sellforte.
Example prompt: "Show our offline media spend by media type for the last four quarters and compare it to digital."
Claude replying with Sellforte MCP:
Other example prompts:
- "How much did we spend on TV, radio and print last quarter?"
- "Show our offline media spend by month and media type this year."
- "Compare online and offline media spend for the last six months."
- "How much of our total media budget went to out of home in New York?"
Offline and digital media are reported together, so a single question can cover the full media mix without stitching numbers from separate reports.
Reporting business outcomes beyond revenue
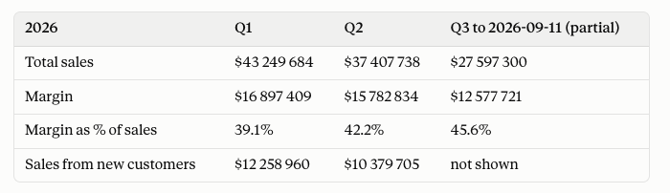
Revenue is rarely the only target. The MCP reports every KPI configured in your Sellforte environment, using the same periods, filters and groupings as sales. Typical KPIs include:
- Contribution margin or gross profit
- Orders or transactions
- New customers and customer acquisition
- Conversions and conversion value from ad platforms
- Category or brand level sales
Example prompt: "Show revenue, contribution margin and new customers by quarter for 2026 so far."
Claude replying with Sellforte MCP:
Other example prompts:
- "What was our contribution margin last quarter?"
- "How many new customers did we acquire per month this year?"
- "Show orders and average order value by market for August 2026."
- "Which KPIs can you report for our environment?"
KPIs are defined during your Sellforte implementation. If a KPI you need is missing, your Sellforte contact person can add it once the underlying data is available.
Incremental ROAS and incremental revenue for digital channels
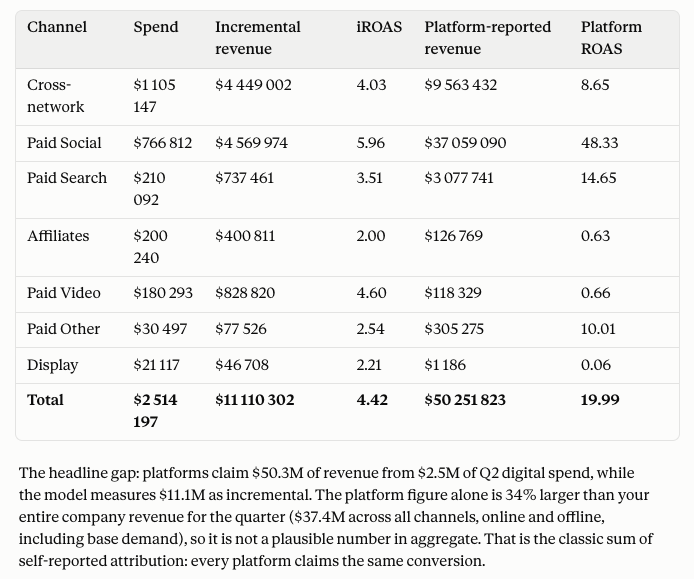
The MCP reports the incremental results from your Marketing Mix Model. For every digital channel, platform, campaign and ad set in your model you can ask for:
|
Metric |
What it tells you |
|---|---|
|
Incremental sales |
The revenue that would not have happened without the media |
|
Incremental ROAS (or ROI) |
Incremental sales divided by spend |
|
Attributed sales and ROI (GA4) |
The last click view, for comparison |
|
Revenue and ROAS (ad platform) |
What Meta, Google or TikTok reports, for comparison |
Having all three side by side is the point: the gap between platform reported ROAS and incremental ROI is usually where budget decisions go wrong.
Example prompt: "Show incremental ROAS and incremental revenue by digital channel for Q2 2026, and compare it to what the ad platforms reported."
Claude replying with Sellforte MCP:
Other example prompts:
- "What was the incremental ROI of each digital channel last quarter?"
- "Compare incremental ROI to Meta reported ROAS for our paid social campaigns."
- "How much incremental revenue did Google Ads generate in Germany this year?"
- "Show the ROI trend for our top three channels over the past 12 months."
Incremental ROAS (ROI) for offline channels
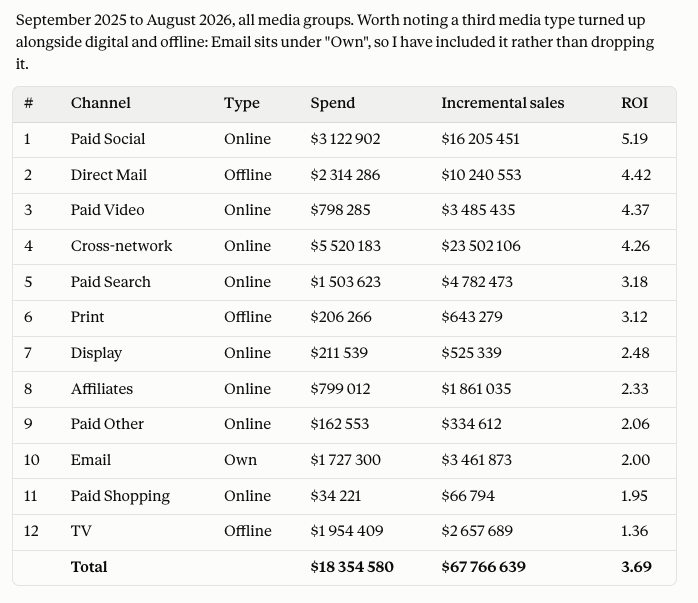
Offline media is measured in the same model as digital, so TV, out of home, radio, print, cinema and direct mail get the same incremental revenue and incremental ROAS figures.
Example prompt: "Rank every channel, digital and offline, by incremental ROI for the last 12 months and show the spend behind each."
Claude replying with Sellforte MCP:
Other example prompts:
- "What was the incremental ROI of TV last year?"
- "How much incremental revenue did out of home and radio generate in the Nordics?"
- "Rank all channels, online and offline, by incremental ROI for 2026 so far."
- "Did print deliver a positive return in our spring campaign?"
Promotion driven revenue and margin
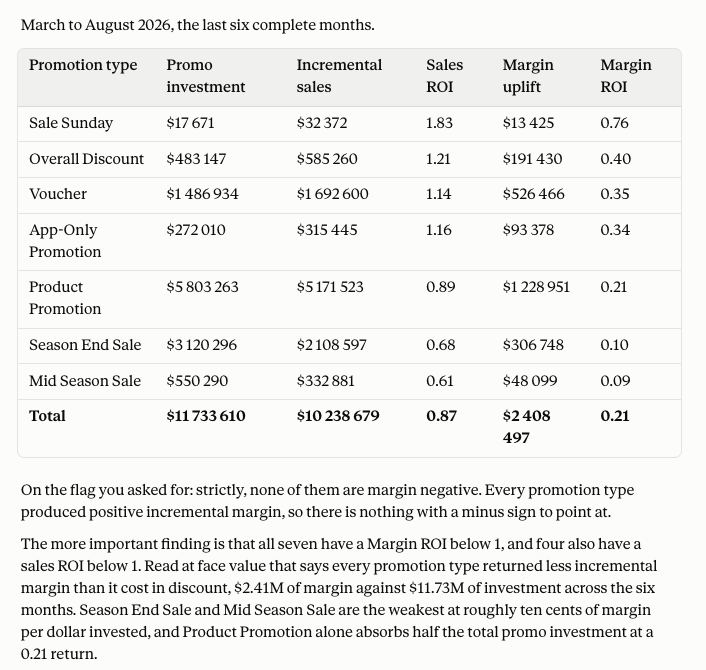
Promotions are modeled as their own revenue driver in most Sellforte models. Metrics include promo investment, incremental sales from promotions, incremental margin and both ROI and margin ROI. Margin ROI is the metric to watch, since a promotion can look strong on revenue while quietly eroding profit.
Example prompt: "Show incremental sales and margin ROI by promotion type for the last six months, and flag the ones that were margin negative."
Claude replying with Sellforte MCP:
Other example prompts:
- "Which promotions delivered the highest incremental uplift last month?"
- "What was the margin ROI by promotion type this year?"
- "How does uplift change by discount depth in the sports category?"
- "How much of last quarter's revenue came from promotions rather than media?"
Because promotions are separated inside the model, the media ROIs reported above are already free of promotion driven revenue. Without that separation, promotional lift leaks into bottom of funnel channels and inflates their apparent return.
Explaining what drove a change
When a KPI moves, the MCP can decompose it into the drivers behind it rather than leaving you to guess. The model splits every KPI into:
- Base, the sales that would have happened without marketing activity
- Media, the incremental contribution of each channel and campaign
- Promotions, the contribution of discounts and price activity
- Other modeled drivers, such as weather, where they are part of your model
The components always sum to the total KPI, so the decomposition reconciles with the sales figures reported at the top of this page.
Example prompt: "Split total sales into base, media, promotions and other drivers by month this year, and explain the biggest change."
Claude replying with Sellforte MCP:
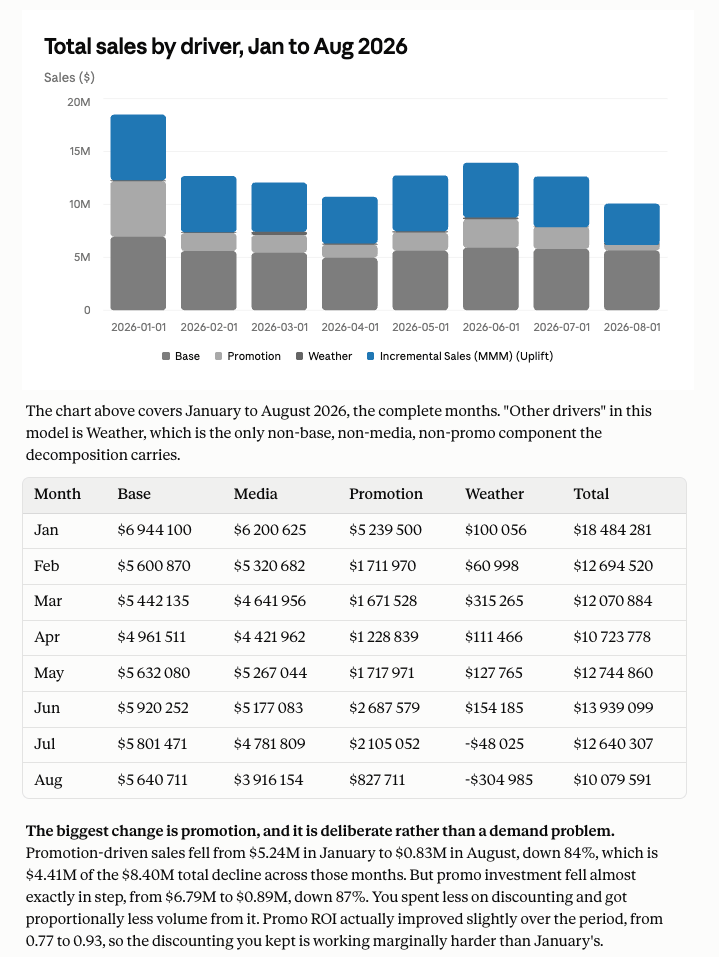
Other example prompts:
- "Why did sales drop in August compared to July?"
- "Split total sales into base, media and promotions by quarter this year."
- "How much of our growth this year came from media rather than from the baseline?"
- "Which channels explain the increase in new customers last month?"
How current the results are
Sellforte typically models at daily granularity, and results update with the daily data pipeline. That means incremental ROAS can be asked for by day, week, month, quarter or year, and a campaign that ended last week already has modeled results.
Example prompt: "Show daily incremental sales and ROI for paid social over the last 30 days, and tell me when the data was last updated."
Claude replying with Sellforte MCP:
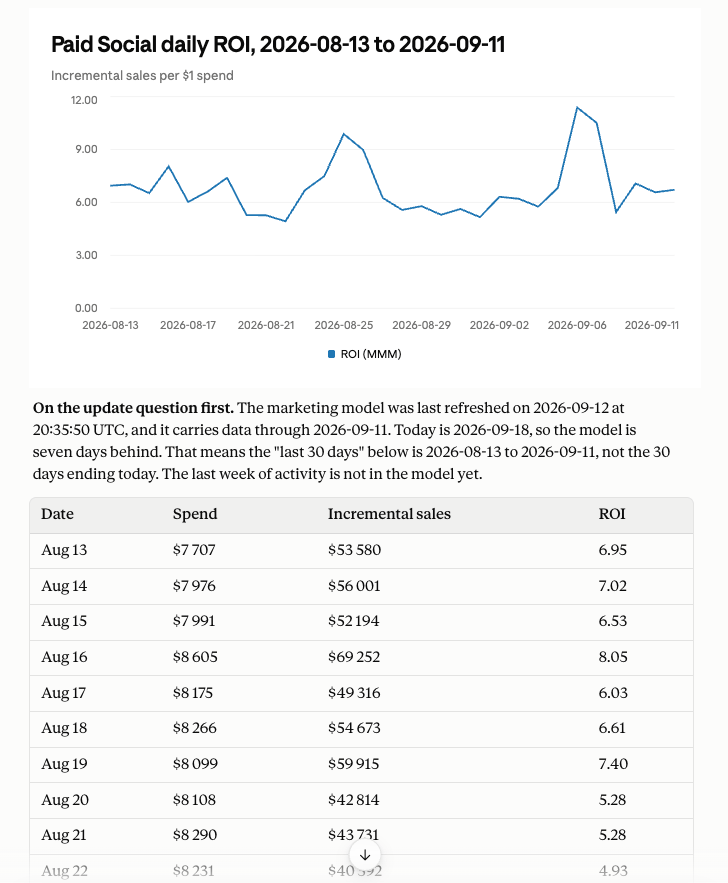
Other example prompts:
- "When was the data last updated?"
- "Show daily incremental sales for paid social over the last 30 days."
- "How has the ROI of our TV campaign developed week by week since it launched?"
The MCP reports the refresh timestamp from your environment, so you always know how recent the answer is.
Filtering and grouping by business dimensions
Every question on this page can be filtered. The MCP resolves the wording you use to the exact values in your data model, so "paid social in Germany" becomes a real filter rather than a guess, and it tells you when a value does not exist.
|
Dimension |
Typical values |
Example |
|---|---|---|
|
Date |
Any period within your data range |
"between 2026-04-01 and 2026-06-30" |
|
Market or country |
Countries and regions in your model |
"in Germany and Austria" |
|
Brand and product |
Brands, product categories |
"for the sports category" |
|
Sales channel |
Online, physical store, marketplace |
"online only" |
|
Customer type |
New, returning, segments |
"new customers only" |
|
Ad platform and channel |
Meta, Google, TikTok, TV, radio |
"across paid social" |
|
Campaign and objective |
Campaign names, campaign objectives |
"for the spring campaign" |
Time granularity is explicit: total for the period, or a breakdown by day, week, month, quarter or year. Comparison periods can be relative, such as year on year, quarter on quarter or the previous period, or two exact dates you name.
How answers are returned
Answers come back in three forms, and you can ask for whichever suits the task:
- Written summary. Totals, top and bottom performers and the direction of change, in plain language.
- Tables and charts. Sellforte renders its own tables and charts inside supported clients, so a monthly trend or a channel comparison appears as a visual, not as raw text.
- Structured rows. The underlying rows come back as structured data, which the client can reuse for a spreadsheet, a slide or a further calculation in the same conversation.
Because the client keeps the conversation, you can refine without starting over: ask for the same query by week instead of month, add a market, or drop a campaign, and only the changed part of the query is rerun.
Tips for reliable answers
- Name the period. "Last month" works, but exact dates such as 2026-04-01 to 2026-06-30 remove any ambiguity about week alignment.
- Use your own business terms. The MCP matches wording such as brand names, market names and campaign names to the values in your data model, and asks for clarification when several values match.
- Ask what is available. "Which metrics and dimensions can you report on?" and "What date range is covered?" return the actual schema and data range of your environment.
- Check freshness for recent periods. Data is refreshed on your environment's own schedule, so the most recent days may not be included yet. Ask when the data was last updated.
- If a value is not recognized, the MCP says so and suggests the closest matching values instead of returning an empty or wrong answer.
Related articles
- Connecting Sellforte MCP to your LLM client
- Promotions Dashboard: Overview
- Media Optimizer Overview
- What is the impact of granularity on Marketing Mix Modelling
Once you can report what happened and why, the next step is planning: optimized budget allocation, forecasts for a specific media plan and incrementality test results. Those questions use the same connection and are covered in their own articles.