Before adopting Marketing Mix Modeling (MMM), many of our customers have been using Google Analytics 4 (GA4) or multi-touch attribution (MTA) for cross-channel digital media measurement and optimization. When our customers see MMM results for the first time, the performance marketing teams are often surprised to see a significant increase in the effectiveness of paid social advertising, compared to their previous measurement methods.
In this article, we will analyse how the effectiveness estimates from GA4, MTA and MMM differ from each other. We'll focus on one ad platform, Meta, because it is among the most significant digital media investments for all of our Retail, eCommerce and DTC customers, and thus optimizing Meta investments can be a large opportunity for driving more growth.
Google Analytics 4 vs. Marketing Mix Modeling
Google Analytics 4 is the most popular website analytics platform, and its attribution modeling features are used by many companies, especially small and mid-sized eCommerce and DTC companies, to measure media effectiveness across channels.
To understand the difference between effectiveness estimates from GA4 and MMM, we analysed a sample of 7 companies in Retail, eCommerce and DTC. We looked into five Meta channels:
- Retargeting: Retargeting campaigns to existing customers
- Prospecting: Prospecting campaigns to new customers
- Advantage+: Advantage+ campaigns
- Sales: Campaigns with Revenue or Conversions as objective
- Awareness: Campaigns with Reach or Impressions as objective
We summarized the differences between GA4 and MMM in the form of “calibration multipliers”, following the terminology established in Google’s Modern Measurement Playbook for the multiplier that is applied to attributed ROAS to arrive at MMM-reported ROI. Below is a chart summarizing our findings:
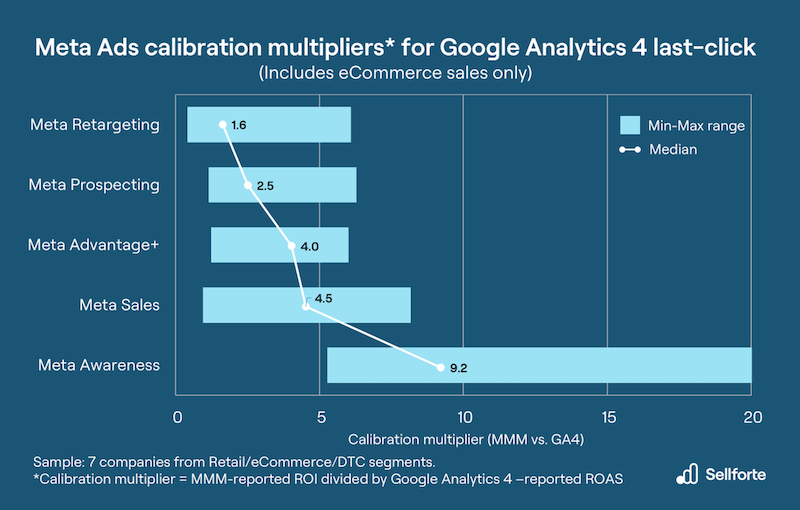
Meta Ads calibration multipliers for Google Analytics 4 last-click
The findings suggest that GA4 is under-reporting the effectiveness of all Meta channels. As an example, to arrive at MMM-reported ROI for Meta Prospecting, one needs to multiply GA4 last-click -reported ROAS with a multiplier of 2.5x (median), which means that GA4 captures only 40% of the effectiveness of Meta Prospecting campaigns. For Meta Advantage+ and Meta Sales channels, median calibration multipliers are 4 and 4.5, respectively, meaning that only 20-25% of the effectiveness of those channels is captured by GA4.
The challenge of under-reporting is further pronounced for Awareness campaigns, for which GA4 last-click attributes very little revenue.
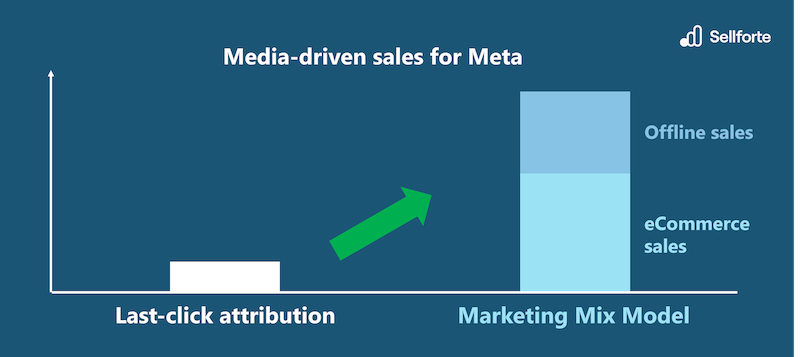
We have only included eCommerce sales in this analysis. For omnichannel retailers, digital media also drives offline sales. If offline sales impact was included in the analysis, the calibration mutlipliers would be even bigger.
👉 GA4 last-click is biased towards under-reporting the effectiveness of Meta. If you have been allocating cross-channel budgets with Google Analytics 4 last-click, you are likely under-investing to Meta.
Multi-touch attribution vs. Marketing Mix Modeling
In the last decade, many large retailers have spent significant amount of money to implement and operate multi-touch attribution solutions. One of the objectives for implementing MTA has been to create fair measurement across all channels, which enables more optimal budget allocation. Many companies are under the belief that this objective was reached, especially for Meta performance channels (Retargeting, Prospecting, Advantage+, Sales). Based on the MTA results we have seen, this is a false belief.
MTA’s ROAS estimates for Meta performance channels are similar to GA4: ROAS for Meta performance channels is typically +10% (median) compared to GA4, ranging between -10% and +20%. This means that also MTA is under-reporting effectiveness of Meta, and one needs to apply large multipliers to MTA’s ROAS to arrive at the level ROI that MMM reports for Meta.
👉 Similarly to GA4 last-click, MTA is biased towards under-reporting the effectiveness of Meta, meaning that you are likely under-investing to Meta if you have been allocating cross-channel budgets with MTA.
GA4 and MTA don’t provide response curves
The findings in previous chapters suggested that GA4 and MTA struggle to capture the true incremental sales impact of Meta, but there are also other differences when it comes to optimization. The most important difference is that GA4 and MTA don’t provide response curves that would reveal the level of saturation in each channel. Below is an example of a response curve.
- X-axis: Investment to the channel.
- Y-axis: Incremental sales one can drive with the investment
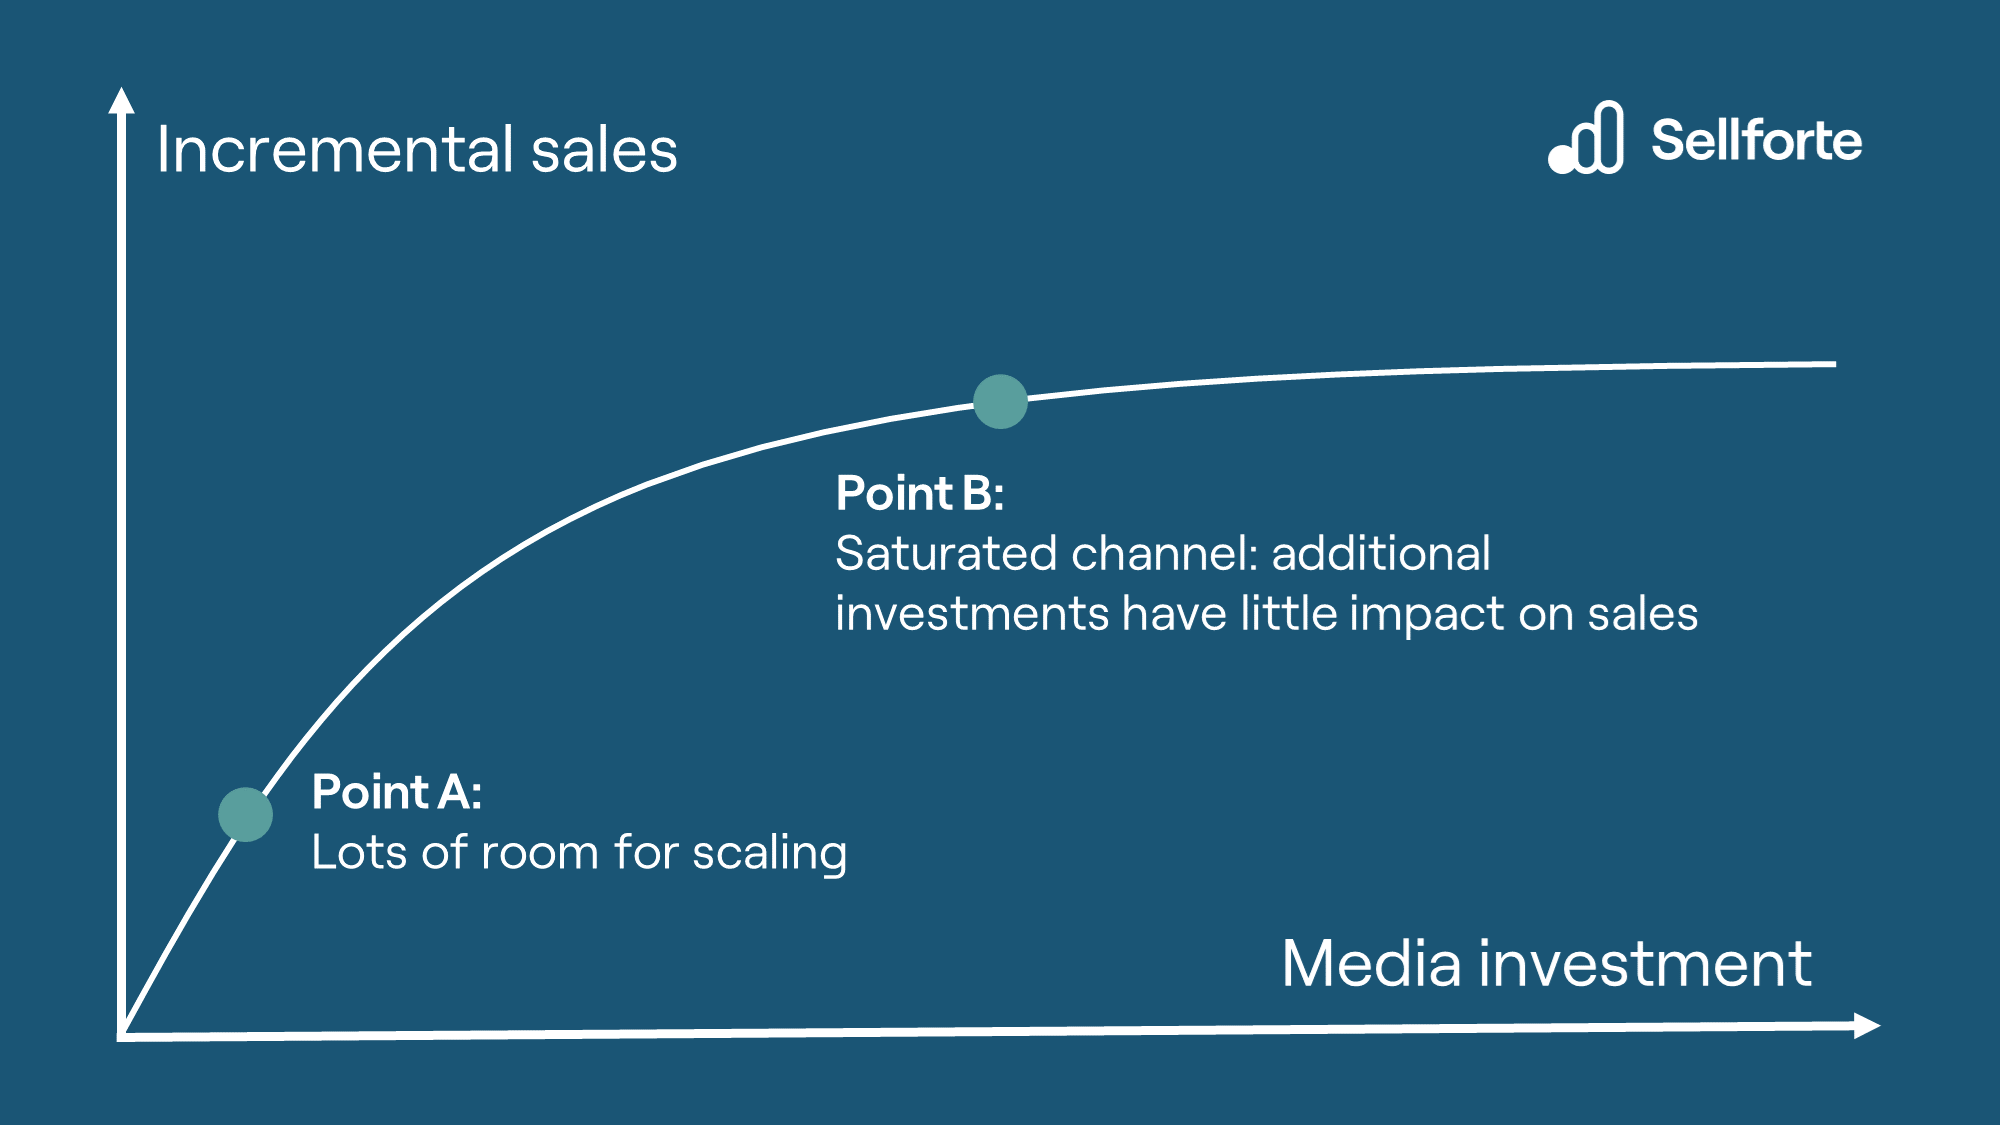 Response curve example
With small investments (Point A), each additional dollar can have high return, which means that the channel can be scaled further. When investments are higher (point B), the channel starts to be saturated, meaning that each additional dollar has significantly lower return than before. For budget optimization, it is critical to understand the curve for each channel, as well as the point where the channel investments are on the curve.
Conclusions
- Both Google Analytics 4 and MTA are biased to under-reporting the effectiveness of Meta
- If you are using GA4 or MTA as your primary source for cross-channel measurement and optimization, you are likely under-investing in Meta
- Use Marketing Mix Modeling to estimate the true ROI of Meta channels and understand the level saturation in each channel
Curious to learn more? Book a demo.


How to measure Meta correctly? Part 2: Add offline sales impact

How to Measure the True Effectiveness of TikTok Ads?