
How shared experiment libraries and transparent calibration workflows turn individual test results into evidence teams can use in attribution and MMM.
An incrementality test produces an estimate of how much additional business a marketing activity generated. The team reviews the result, discusses the implications, and makes a decision.
Then another test arrives. It covers the same channel, but a different market, campaign mix, or spending level. Its result differs from the first.
As the number of experiments grows, teams need a consistent way to decide what all this evidence means for their ongoing measurement.
This is where I see the incrementality testing discussion moving: from executing individual tests to building the infrastructure for using their insights. Two developments are particularly interesting to me: experiment libraries and calibration interfaces.
From scattered test results to an experiment library
Throughout history, libraries have helped people build on existing knowledge. They preserve what has been learned, organize it in a common way, and make it accessible to others.
Experiment libraries can do the same for marketing measurement.
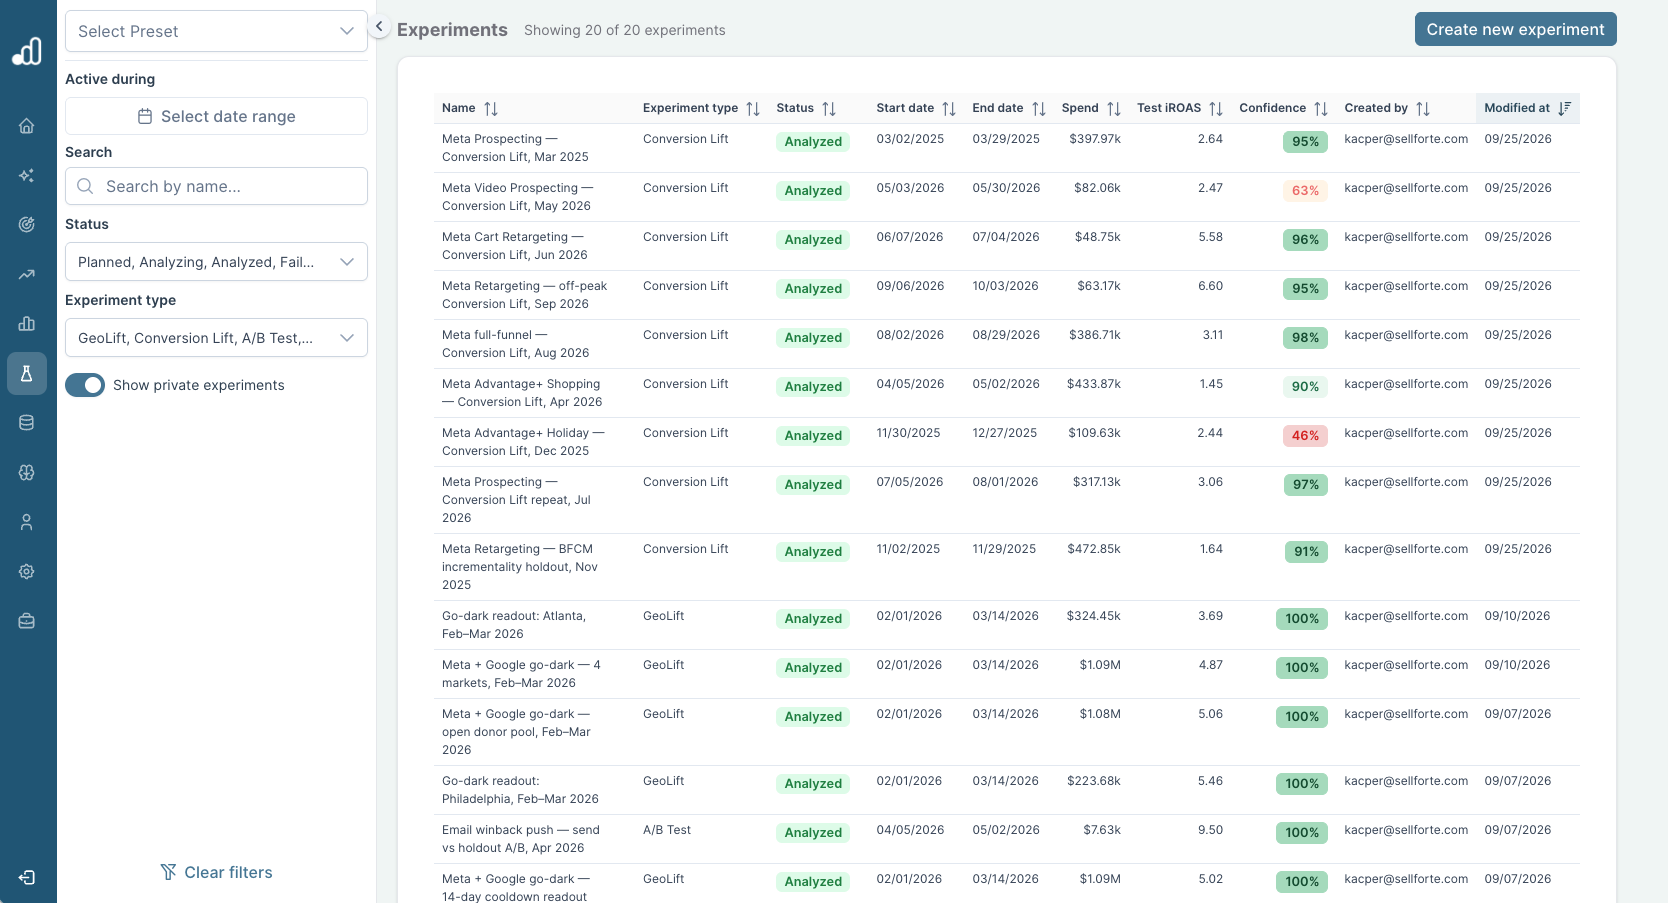
Today, a company’s experiment history might be spread across agency presentations, spreadsheets, and ad platform dashboards. Finding out what was tested last year can require finding the person who ran it. Understanding whether that result is relevant today takes even more work.
A shared library gives the marketing team a place to find previous experiments and enough context to interpret them.
That context matters. “Meta iROAS was 3” leaves many questions unanswered. Was the test measuring the whole account or selected campaigns? Did it include app purchases? What was the spending level? How uncertain was the estimate?
A useful experiment record should include:
- Test design, and treatment and control definitions.
- The market, channels, campaigns, and audiences covered.
- The treatment dates and any post-treatment observation period.
- The outcome measured, including the sales channels covered.
- Spend, incremental outcomes, and the estimated return with its uncertainty.
Great library comprehensively cover different types of books and topics. The same applies for experiment libraries. A library should not only contain geo tests, but also Meta Conversion Lift studies, and A/B tests for owned media. A common structure makes them easier to find and compare while preserving what each method actually measured.
Two ways to use experiment results
Once experiments are organized, the next task is connecting them to ongoing measurement. There are two main use-cases for incrementality tests.
Incrementality-correcting attribution
A test provides a factor for adjusting attributed results.
Suppose an ad platform reports a ROAS of 10 during the test period, while the experiment estimates an incremental ROAS of 5 for the same scope. The implied incrementality factor is 50%. Applying that factor to comparable attributed results gives an estimate of incremental performance.
For smaller ecommerce businesses, this can be a practical starting point towards incrementality-based measurment, before adopting a full MMM. It brings experimental evidence into reporting they already use.
Calibrating MMM
In a marketing mix model (MMM), the experiment informs the model’s estimate of a channel’s incremental contribution.
The input includes an iROAS estimate tied to a particular period and spending level, together with its uncertainty. In a Bayesian MMM, this can inform a prior: a distribution describing plausible values before the model combines that information with the observed data.
From static insights to a calibration interface
The use-cases desribed above become harder to maintain when a team runs tens or hundreds of experiments across markets and channels.
Each new result needs to be considered alongside the existing evidence. It may reinforce an estimate, challenge it, or apply to a different part of the business altogether. A spreadsheet containing the latest factor for each channel gives little visibility into those decisions.
This is why the connection between the experiment library and ongoing measurement needs a proper calibration interface.
The calibration interface needs to have three capabilities:
1. Match experiments to the mode's structure: One topic that comes up repeatedly in our work is the mismatch between experiment scope and model structure. A single conversion lift study might include traffic, awareness, and sales campaigns, while the MMM represents those campaign types separately. The experiment estimates their combined effect. Using it at a more granular level requires a documented allocation method or a modeling approach that can retain the combined constraint.
2. Account for overlapping evidence: This distinction also matters when combining evidence. Splitting one study into several rows does not create several independent experiments. More broadly, partially overlapping studies need careful handling. Tests may share control groups, populations, or underlying observations. A library can also contain several analyses or exports of the same experiment. Treating these as independent evidence can make the combined estimate appear more certain than it should. Overlapping dates alone do not establish that two tests duplicate each other. The system needs enough information about their design and origin to determine how they are related.
3. Weight results by relevance and uncertainty. Weighting introduces another set of choices. A large experiment may represent more business activity without being the most relevant evidence for today’s campaign setup. An older test may remain informative if little has changed. A recent test with a wide uncertainty interval should contribute differently from a precise result under comparable conditions. Uncertainty should travel with the evidence throughout this process. A valid experiment with an inconclusive result may still provide information. Its contribution should reflect how much it tells us, with clear criteria for including or excluding it.
Make calibration outputs traceable
The calibration interface should make these choices visible. For each estimate, the team should be able to inspect the contributing experiments, their weights, the assumptions used to reconcile differences in scope, and any exclusions.
In the example below, four experiments contribute to a Meta Prospecting estimate of 3.01 iROAS, with a pooled interval of 2.78 to 3.25. The same view provides an ad-platform incrementality factor of 0.27, which can be used to adjust comparable attributed results to 27% of their reported value.
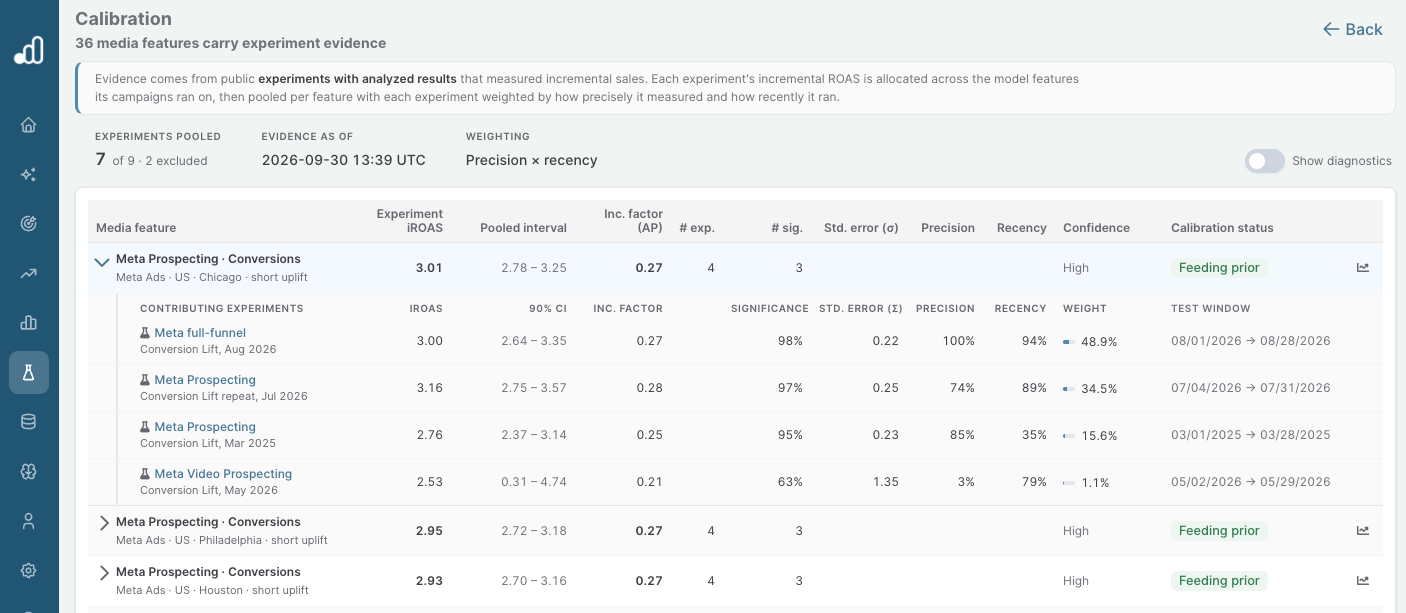
The expanded view shows why the tests contribute differently. The May video-prospecting study has a wide interval and receives 1.1% of the weight; the more precise August study receives 48.9%. The team can inspect how each experiment contributes to the combined estimate and how much influence it has.
It should also explain changes over time.
When a new study enters the library, users should be able to see the previous estimate and the proposed update. They should understand whether the change came from new evidence, revised campaign mapping, a different weighting rule, or a correction to the source data.
This has a direct effect on whether people use the results. In a recent discussion I had with a marketing team, channel owners struggled to recommend budget changes because they could not reconcile the model’s reported returns with the conversion lift studies they knew. Resolving that required tracing the calculation from the original study through allocation and aggregation to the model output.
That traceability belongs in the measurement workflow.
Use the evidence to decide what to test next
The same infrastructure can help teams decide what to test next. A library connected to calibration can reveal where current estimates depend on old experiments, evidence borrowed from another market, or assumptions about outcomes the original study never measured.
For a team developing this capability, I would start with one important channel. Gather its experiment history, agree on the scope of the estimate needed today, and document how each study contributes. Then make that calculation repeatable when the next result arrives.
Doing this exposes the practical requirements for both the library and the calibration interface. It also gives the team something concrete to evaluate: whether they can explain the number they are using, where it came from, and why it changed.
Author

Lauri Potka is the Chief Operating Officer at Sellforte, with over 15 years of experience in Marketing Mix Modeling, marketing measurement and media spend optimization. Before joining Sellforte, he worked as a management consultant at the Boston Consulting Group, advising some of the world’s largest advertisers on marketing optimization. Follow Lauri on LinkedIn.

What is the best incrementality test?
How Can You Unlock the Full Potential of MMM with Campaign Dimensions?