
The results of Sellforte's 2026 Customer Happiness Survey are in, and they give us plenty to celebrate.
Running this survey is something we place great value on at Sellforte.
Every year, we ask our customers the same core questions. This helps us see what is improving, where we need to raise the bar, and whether our work is creating real value. Every year, the whole company reviews the results together.
For me, the written feedback matters more than the score itself, so it's always where I start. This time, two things stood out right away:
- Customers described concrete business outcomes they had achieved with Sellforte. In earlier surveys, the feedback often stopped at insights. This year, customers told us what those insights helped them do.
- Customers named product releases without being prompted. We shipped 17 product launches since the previous survey, and it was rewarding to see that work reflected back to us.
One comment captured the responsibility behind these results well: major financial decisions are made on the back of Sellforte's analysis, so trust in those results is everything.
That is what makes this year's feedback so exciting! Our customer relationships remain strong, our product capabilities continue to grow, and Sellforte keeps helping teams turn marketing measurement into better business decisions.
Let's take a closer look.
NPS Reaches 64 Overall and 71 Among Enterprise Customers
NPS has been our primary customer measure since 2022. Asking the same structured question each year gives us a consistent view of our progress and, because NPS is widely used, a point of comparison with other companies.
Our company value #5, Openness and Honesty, means sharing the full picture. That is why each annual result is public:
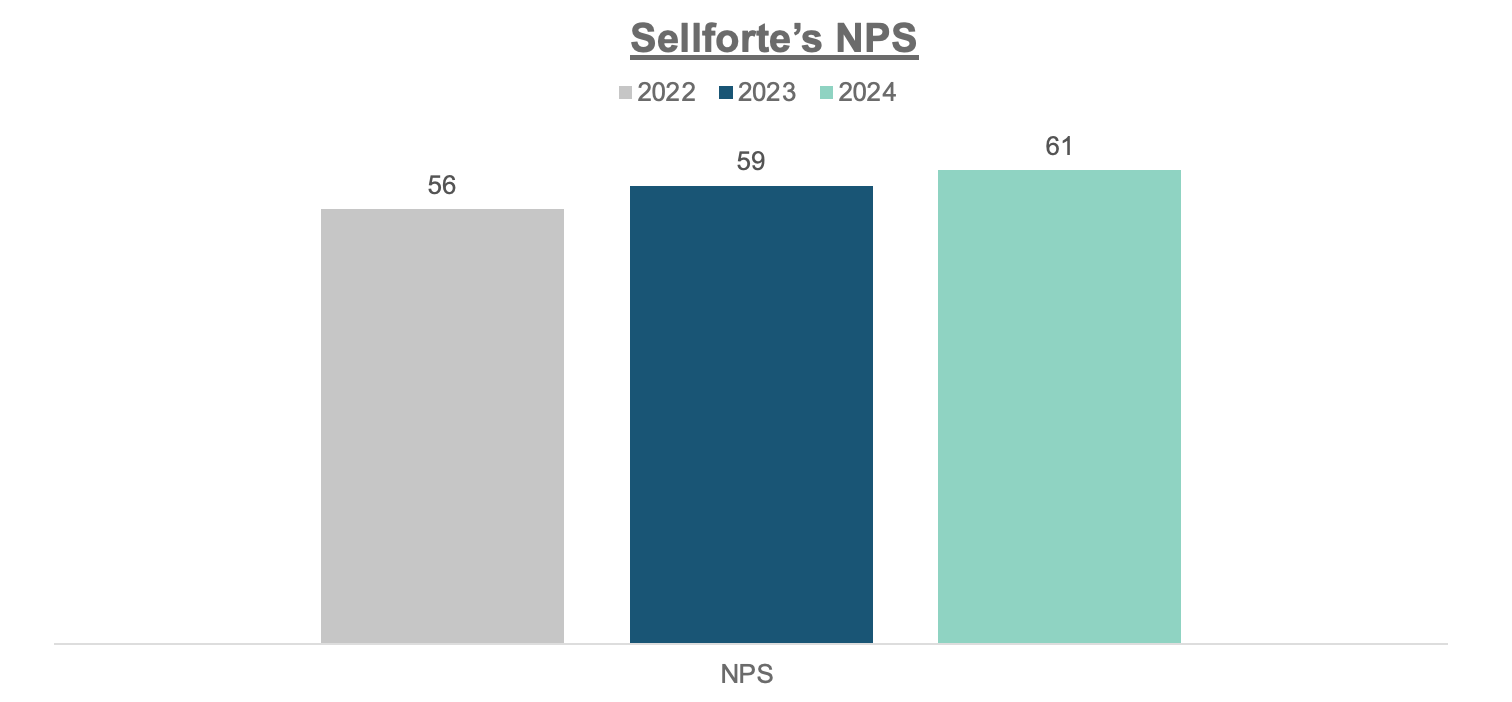
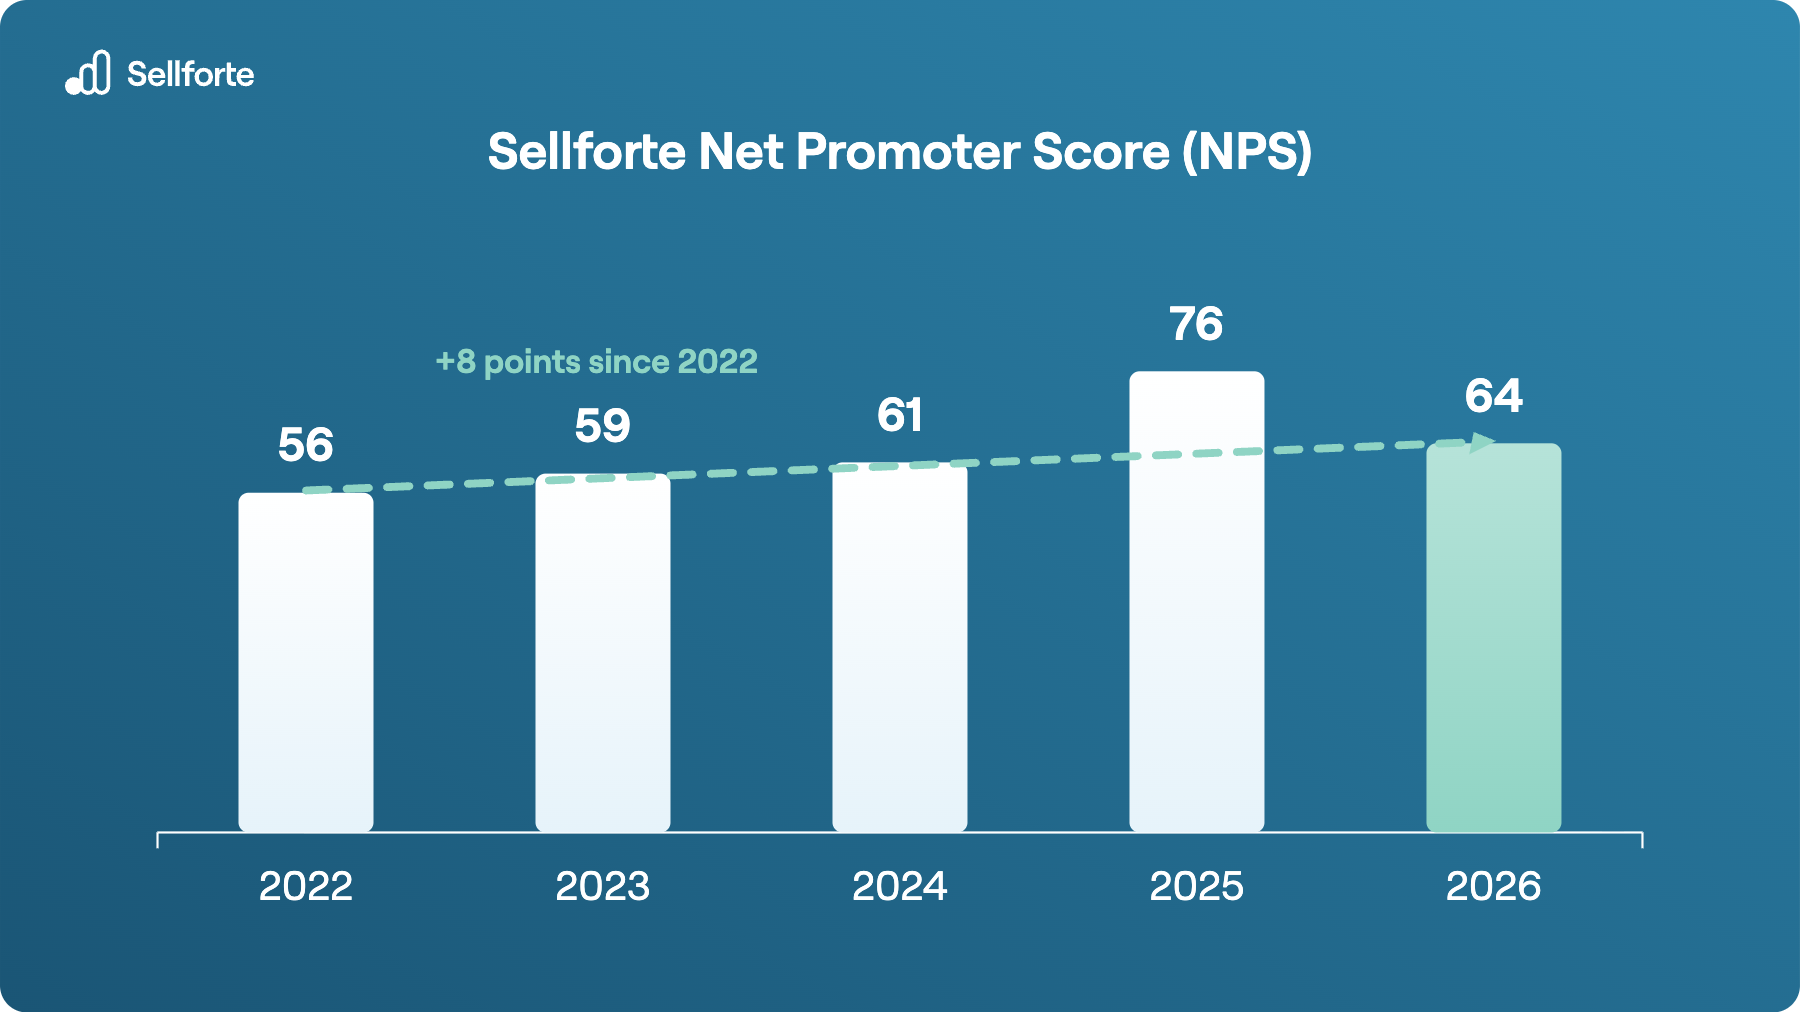
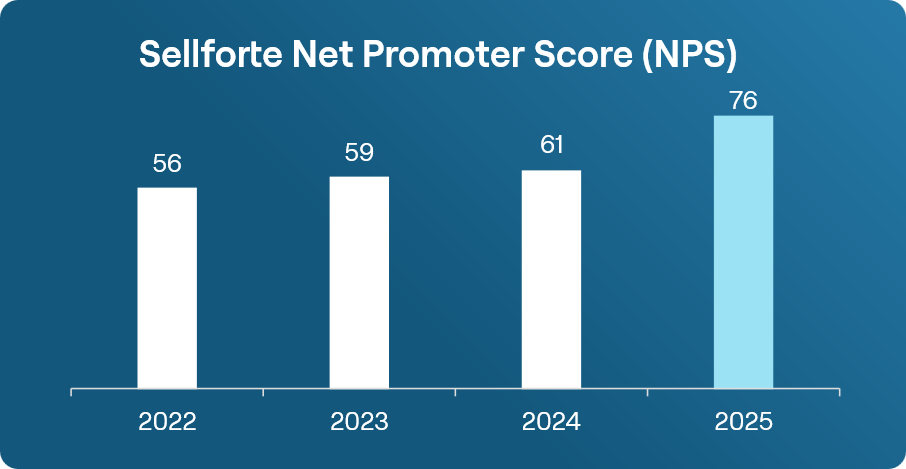
- In the 2022 NPS study, we got a score of 56.
- In the 2023 NPS study, we improved the score to 59.
- In the 2024 NPS study, we improved it again to 61.
- In the 2025 NPS study, we reached our highest score so far, 76.
- In 2026, our NPS reached 64, eight points above where we started in 2022.
This year's score comes from a broader and more representative group of the companies we work with, giving us an especially valuable view of the customer experience and where we should focus next.
An NPS of 64 also remains well above the average for our category. B2B software and SaaS companies average an NPS of 41, according to Retently's 2026 NPS benchmark.
The segment results gave us another reason to celebrate: enterprise customers awarded Sellforte an NPS of 71. Across our customer base, we also saw a clear direction for the future. Teams without a dedicated analyst want the product to do more of the work independently, and that is exactly where we are heading.
We also asked respondents to elaborate on the score they gave.
💬 Written feedback: What is the primary reason for your score?
"Sellforte delivers a product that perfectly meets our business needs, but that is not the only reason I highly recommend them. I can also count on an excellent customer support team that is always helpful, collaborative, and readily available to resolve any issues that arise."
"Extensive expertise, collaborative partnership, and a consistent focus on delivering effective solutions."
"The tool is industry-leading, and what is important is that I can trust Sellforte's expertise and that the results are reliable. Major financial decisions are made based on them, so trust is really important."
1. Value Delivery: Customers Are Turning Insights into Action
Impact has been central to Sellforte from day one. For us, it means analysis that influences how a company allocates its budget and the sales and profit that follow. Hearing customers connect our work to those outcomes is the clearest sign we are delivering on that promise.
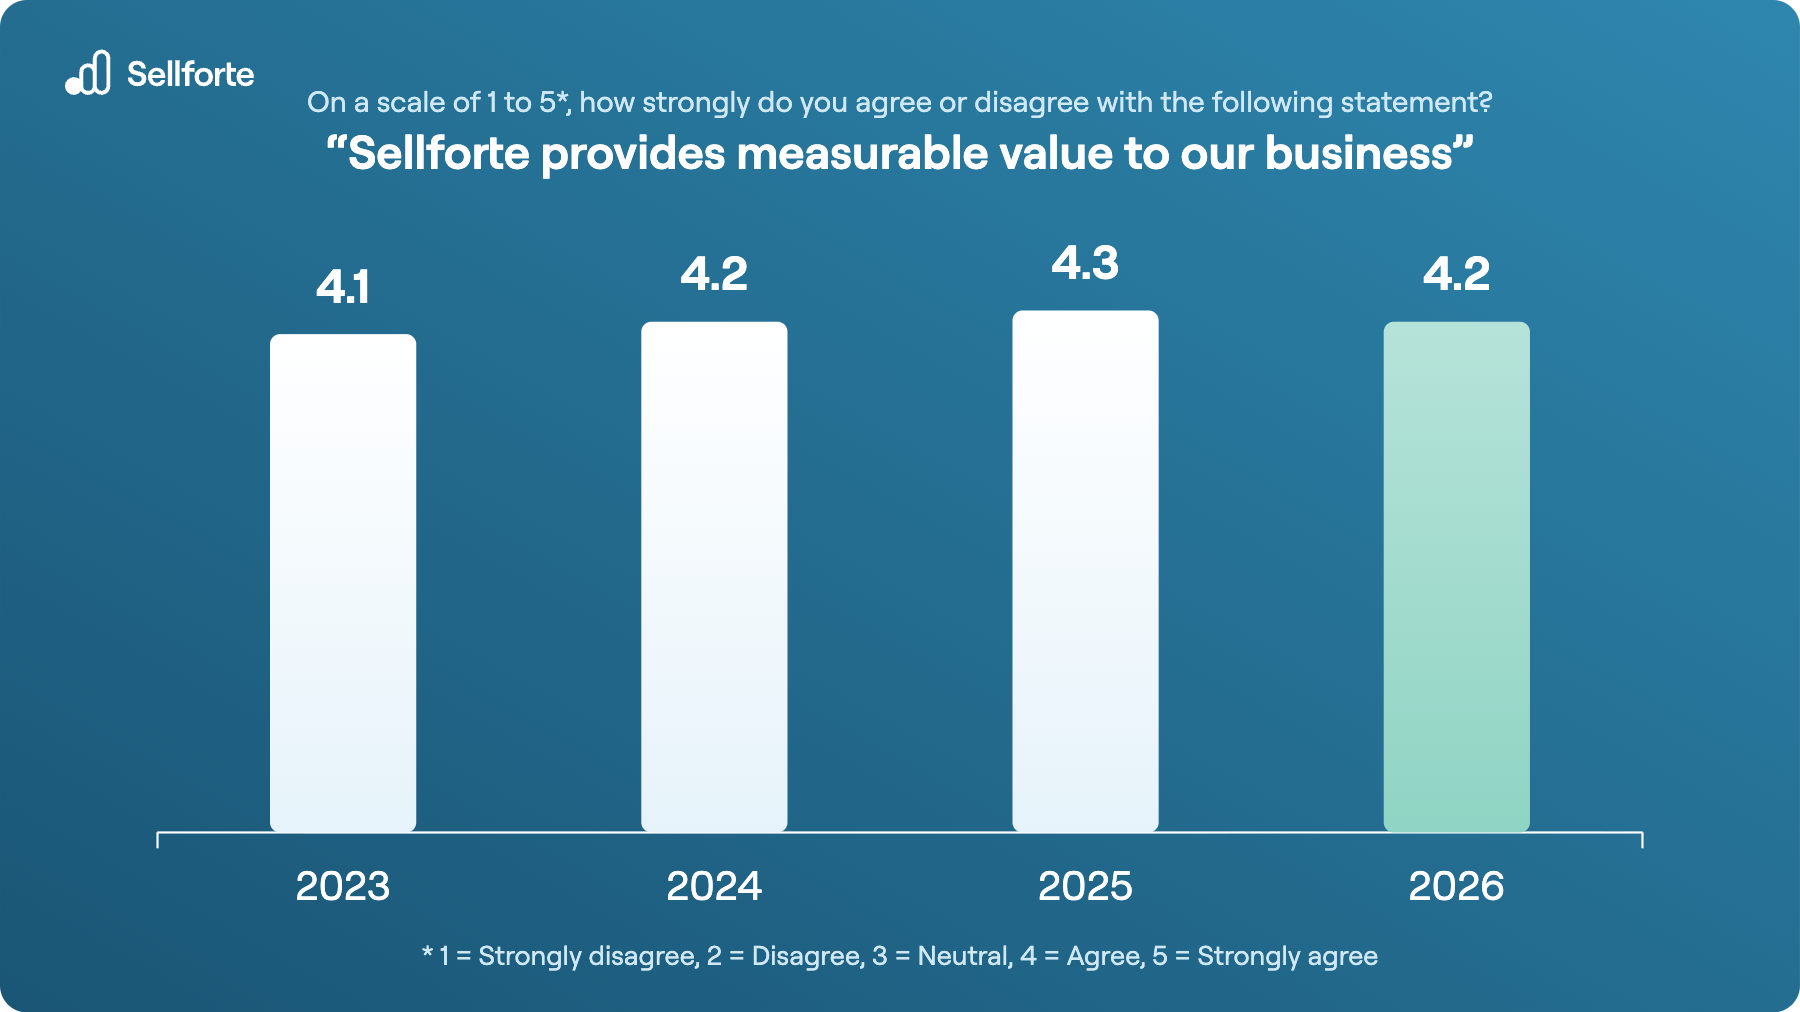
This year, customers rated the statement "Sellforte provides measurable value to our business" at 4.2 out of 5. The score is stable over time and remains strong, while still giving us room to improve.
When asked to identify Sellforte's most significant benefits, these three ranked at the top:
- Making better marketing decisions when planning activities and budgets
- Understanding how marketing drives sales, base versus incremental, at a granular level
- Proving marketing's impact to other departments
The most exciting change this year is in the language customers used. They described Sellforte shaping their investment decisions and their plans for the next fiscal year.
💬 Customers' comments on Value
"The results help our marketing team to assess and communicate marketing effectiveness and optimize the media investment."
"Sellforte has quickly become a real asset for us and delivers insights across different angles. It has already shaped how we're thinking about budget planning going into the new fiscal year."
2. Product: Feature Relevance at a Four-Year High
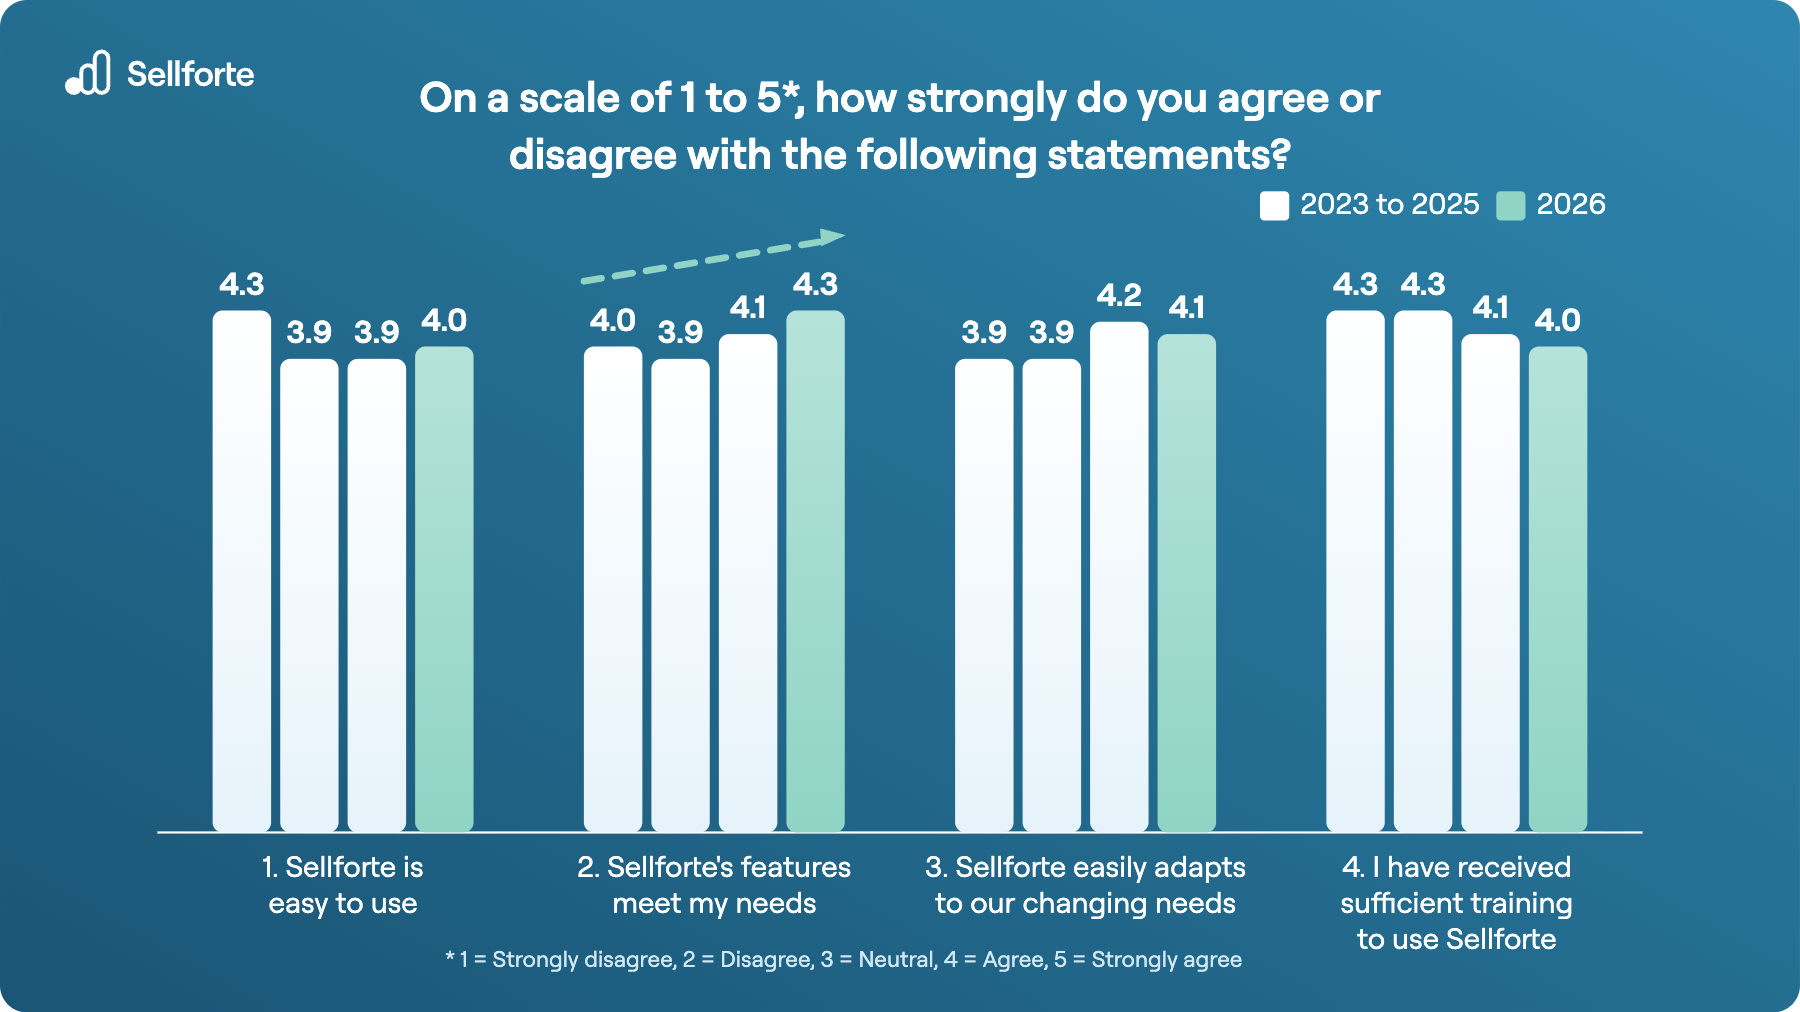
This was one of my favorite findings in the entire survey: "Sellforte's features meet my needs" reached 4.3 out of 5, our highest score for any product statement in four years and the third consecutive year of improvement.
The product results were strong across the board:
- Features meet my needs: 4.3, up from 4.1
- Sellforte is easy to use: 4.0, up from 3.9 in each of the previous two years
- Sellforte adapts to our changing needs: 4.1
- I have received sufficient training to use Sellforte: 4.0
This was also the first year customers mentioned our product development without being asked. Continuous improvements, new features, UI enhancements and Change Intelligence all appeared in the comments. After 17 releases in a year, seeing customers notice that work meant a lot to the team.
💬 Customers' comments on Product
"Great interface and data insights that can be used for hands-on optimization."
"Excellent customer success team and very helpful, knowledgeable wider team. The UI has improved a lot over time, although it could still be slightly more user-friendly."
Of course, the feedback also showed us where we need to do better. Ease of use remains the biggest source of friction. Training received a solid 4.0 but declined marginally from last year.
Our pace of product development has created a new challenge. Each product release brought new features to explore and new use cases to support. As the product evolves faster, our learning materials need to keep pace. That is a practical gap, and one we are aiming to close.
3. Service: Exceptional Scores Continue
Great technology only creates value when people can use it with confidence. That is why customer service is an essential part of the Sellforte experience, and the 2026 responses show that it remains one of our clearest strengths.
Satisfaction with the Sellforte customer team reached 4.7 out of 5, and the statement "I feel the Sellforte team listens to our needs well" also received 4.7. Neither score has fallen below 4.6 in any year we have measured them.
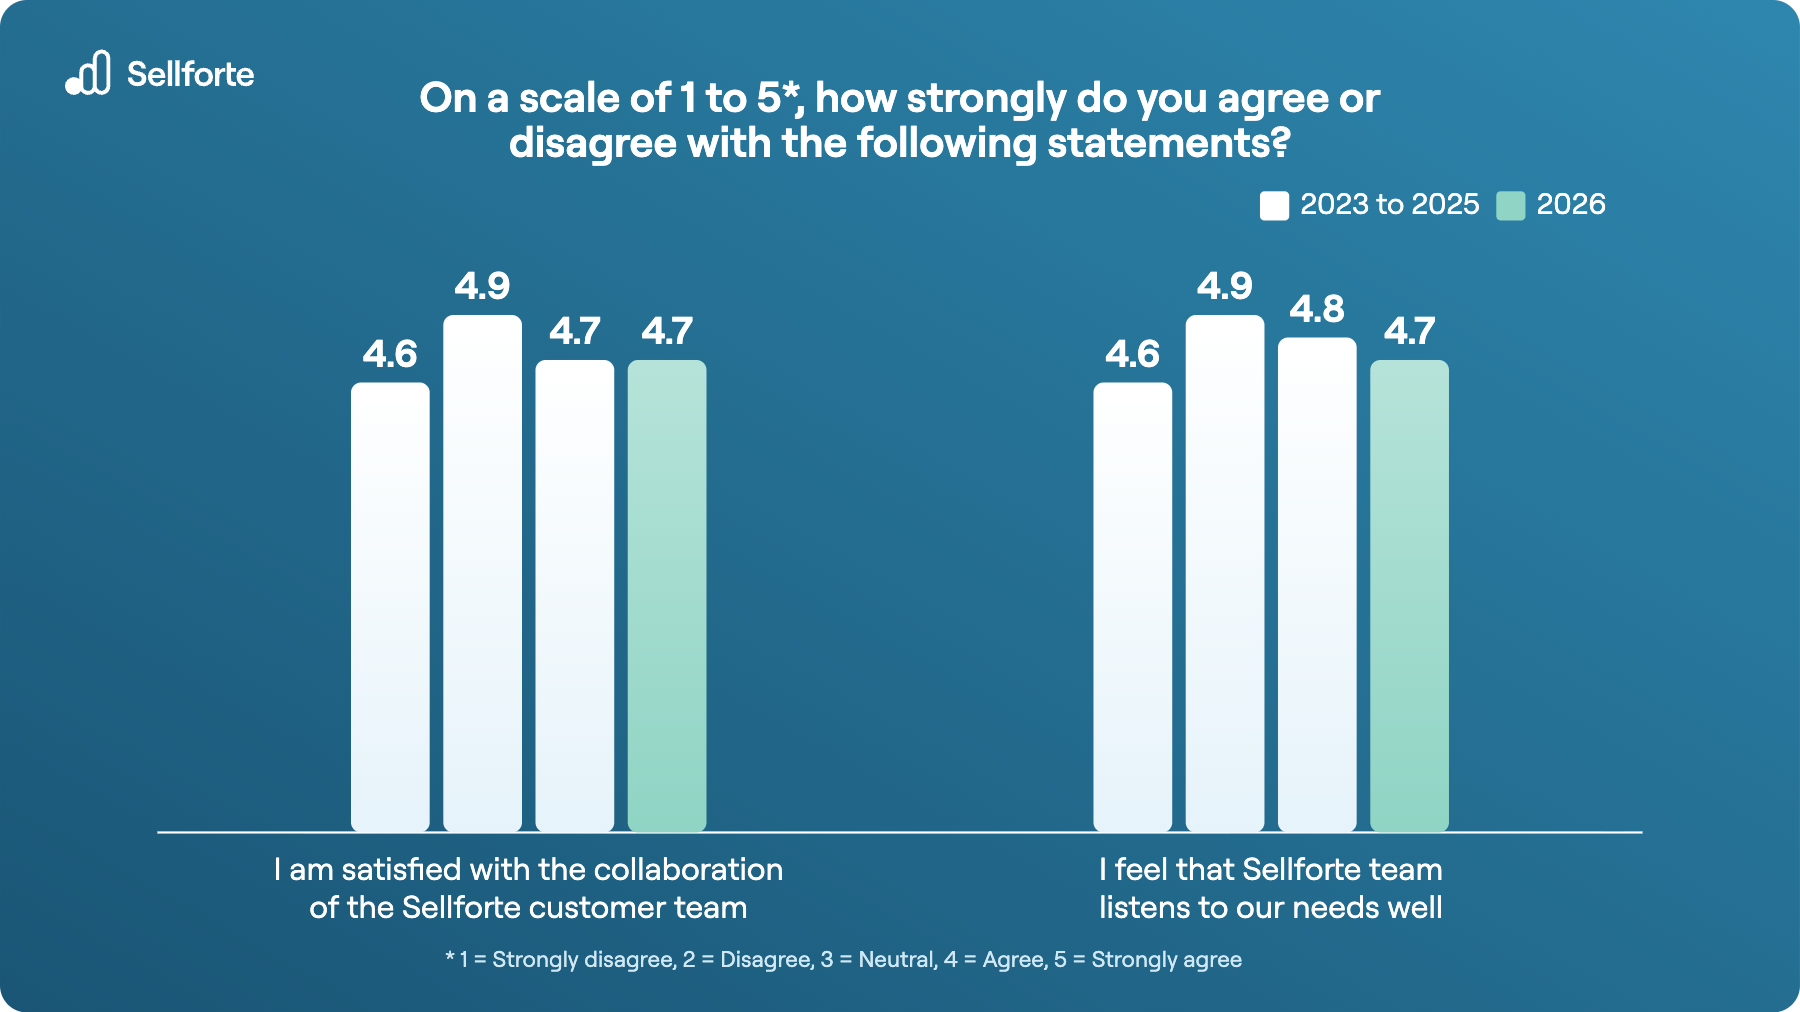
That consistency matters. Collaboration has been the strongest single driver of customer advocacy in every survey we have run.
💬 Customers' comments on Service
"Great collaboration, transparency, flexibility, and quality of services."
"Using the UI in daily work is really easy, and the people at Sellforte are always helpful and professional."
Key Takeaways from the Customer Happiness Survey
The survey confirms what is working and makes our next priorities impossible to miss. More importantly, the next steps are already in motion.
- Make it easier for customers to keep pace. Customers want faster, more flexible ways to learn new workflows and get more from every product release. We are improving our self-service learning resources while making Sellforte increasingly intuitive and self-explanatory.
- Turn recommendations into clear action plans. Customers want every recommendation to make the next move obvious. We are connecting recommendations with expected impact and follow-up, making it easier to understand what to do, why it matters, and what the outcome could be.
- Apply AI where it can create the greatest impact. Customers identified budget allocation, forecasting, and root-cause analysis as the areas where AI could add the most value. We are focusing Sellforte AI and Sellforte MCP on these priorities, helping teams move faster from a question to a confident decision.
What stays with me most is how well the different parts of the story reinforce one another: exceptional customer advocacy, a product that is becoming more relevant each year, and a team customers consistently trust. Together, they move us closer to our ambition of becoming the global leader in marketing measurement and optimization.
Thank you to everyone who took the time to respond, and especially to those who told us what is not working yet. The praise gives us energy. The constructive feedback makes the next release better.
In 2027, we will ask the questions again, listen closely, and share the results openly, whatever they show.
💡 Ready to turn marketing measurement into measurable business impact?
See how Sellforte can help your team measure marketing more clearly, optimize investment, and drive growth.
Book a demo today!

Samantha Lee-Uusitupa is a Client Partner at Sellforte. She has more than 10 years of experience in measuring and improving marketing performance, most of it focusing on Marketing Mix Modeling. Before joining Sellforte, Samantha held positions at Nissan and Analytic Partners. Follow Sam in LinkedIn.
Methodology of Sellforte Customer Happiness Survey
What is Net Promoter Score (NPS)?
Net Promoter Score (NPS) is a metric used to measure customer loyalty and satisfaction. It helps businesses understand how customers feel about their products or services and predicts customer behavior such as repeat purchases or recommendations to others.
NPS uses a scale of 0 to 10 to determine customer satisfaction. For example, one could pose the question "On a scale of 0 to 10, how likely are you to recommend our product or service to a friend or colleague?" Based on their responses, customers are categorized into three groups:
- Promoters (scores 9-10): Highly satisfied customers who are enthusiastic about recommending the company.
- Passives (scores 7-8): Satisfied but not overly enthusiastic customers who might be swayed by competitors.
- Detractors (scores 0-6): Unhappy customers who are unlikely to recommend the company and may even discourage others from using its products or services.
To calculate the NPS, subtract the percentage of Detractors from the percentage of Promoters. The result can range from -100 to +100, with higher scores indicating greater customer satisfaction and loyalty.
💡Net Promoter Score formula
Net Promoter Score = % Promoters - % Detractors
For example, if 50% of respondents are Promoters, 20% are Passives, and 30% are Detractors, the NPS would be 20 (50% Promoters - 30% Detractors).
In our 2026 survey, two thirds of respondents were Promoters and fewer than 4% were Detractors, giving us an NPS of 64.
What is a good NPS for a B2B SaaS company?
NPS is most useful when compared against a benchmark. B2B software and SaaS companies average an NPS of 41, according to Retently's 2026 NPS benchmark, which draws on a dataset of more than 10,000 surveys. Our 2026 score of 64 sits well above that average, as it has in every year we have run this survey.
How was the survey conducted
Here's a breakdown of how the survey was conducted:
- Survey Timeline: The survey was launched on the 12th and closed on the 29th of May.
- Distribution: The survey link was sent by each Customer Success manager to their clients, followed up by reminders a week later.
- Incentives for Participation: To encourage participation, we offered gift cards. Sharing company information and an email address was optional.
- Respondents: 60% of responses came from Enterprise customers and 40% from eCommerce. Consumer goods and specialty retail were the largest industry groups, followed by fashion and beauty, and grocery.
- Rating scales: Alongside the NPS question, respondents rated a series of statements on quality, collaboration and value delivery from 1 (strongly disagree) to 5 (strongly agree).
Sellforte Achieves 76 NPS in 2025 Customer Happiness Survey
.png?width=4292&height=2861&name=MicrosoftTeams-image%20(4).png)
Delivering measurable customer value: Sellforte Customer Happiness Survey 2022 received an NPS of 56%