Marketing Mix Modeling (MMM) is a statistical analysis technique used to measure how different marketing activities (and other external factors) impact sales or business outcomes.
MMM has seen a rapid increase in popularity in the recent years. And it's clear why.
For ecommerce and DTC businesses, it unlocks campaign optimization based on true incremental sales impact of each campaign, instead of using last-click attribution that favors bottom-of-funnel channels.
For retailers, it finally provides visibility into how digital channels are driving store sales, not just the ecommerce sales.
We also see industry giants, such as Meta and Google, strongly advocating for MMM, because click-based attribution is not able to capture the full impact of their media, such as Paid Social, Paid Video.
And there's also the privacy-trend: marketers are being pushed towards measurement that does not leverage privacy-sensitive data, and which is resistant to loss of cookies and rise of consent forms.
But what exactly is Marketing Mix Modeling (sometimes also referred to as Media Mix Modeling), and how does it work? Let’s dive in.

Why Marketing Mix Modeling Matters for Advertisers
Marketing Mix Modeling helps marketers drive more sales & profits, and prove the value of marketing.
MMM’s business case is simple to evaluate because MMM-based optimization decisions are directly impacting revenue and profit.
Based on our research, optimizing spend allocation with Marketing Mix Modeling drives a +6.5% sales increase for ecommerce and DTC brands without increasing advertising spend. In omnichannel retail the sales improvement potential is +1.6% (without change in spend). The image below shows the levers for realizing the improvement potential for ecommerce & DTC brands.
Let’s next walk through each improvement lever one by one.

Lever 1: Optimize spend allocation across campaigns
Marketers might not immediately associate Marketing Mix Modeling (MMM) with campaign-level optimization because MMM has traditionally been used in high-level channel allocation decisions.
This has changed. Modern MMM solutions today offer campaign and ad set level optimization for driving growth. And the potential is large: ecommerce and DTC brands can unlock +2.9% additional sales by reallocating budgets across campaigns and ad sets based on MMM insights. Below is an example of Sellforte Performance, which provides spend and bidding recommendations for each campaign and ad set:
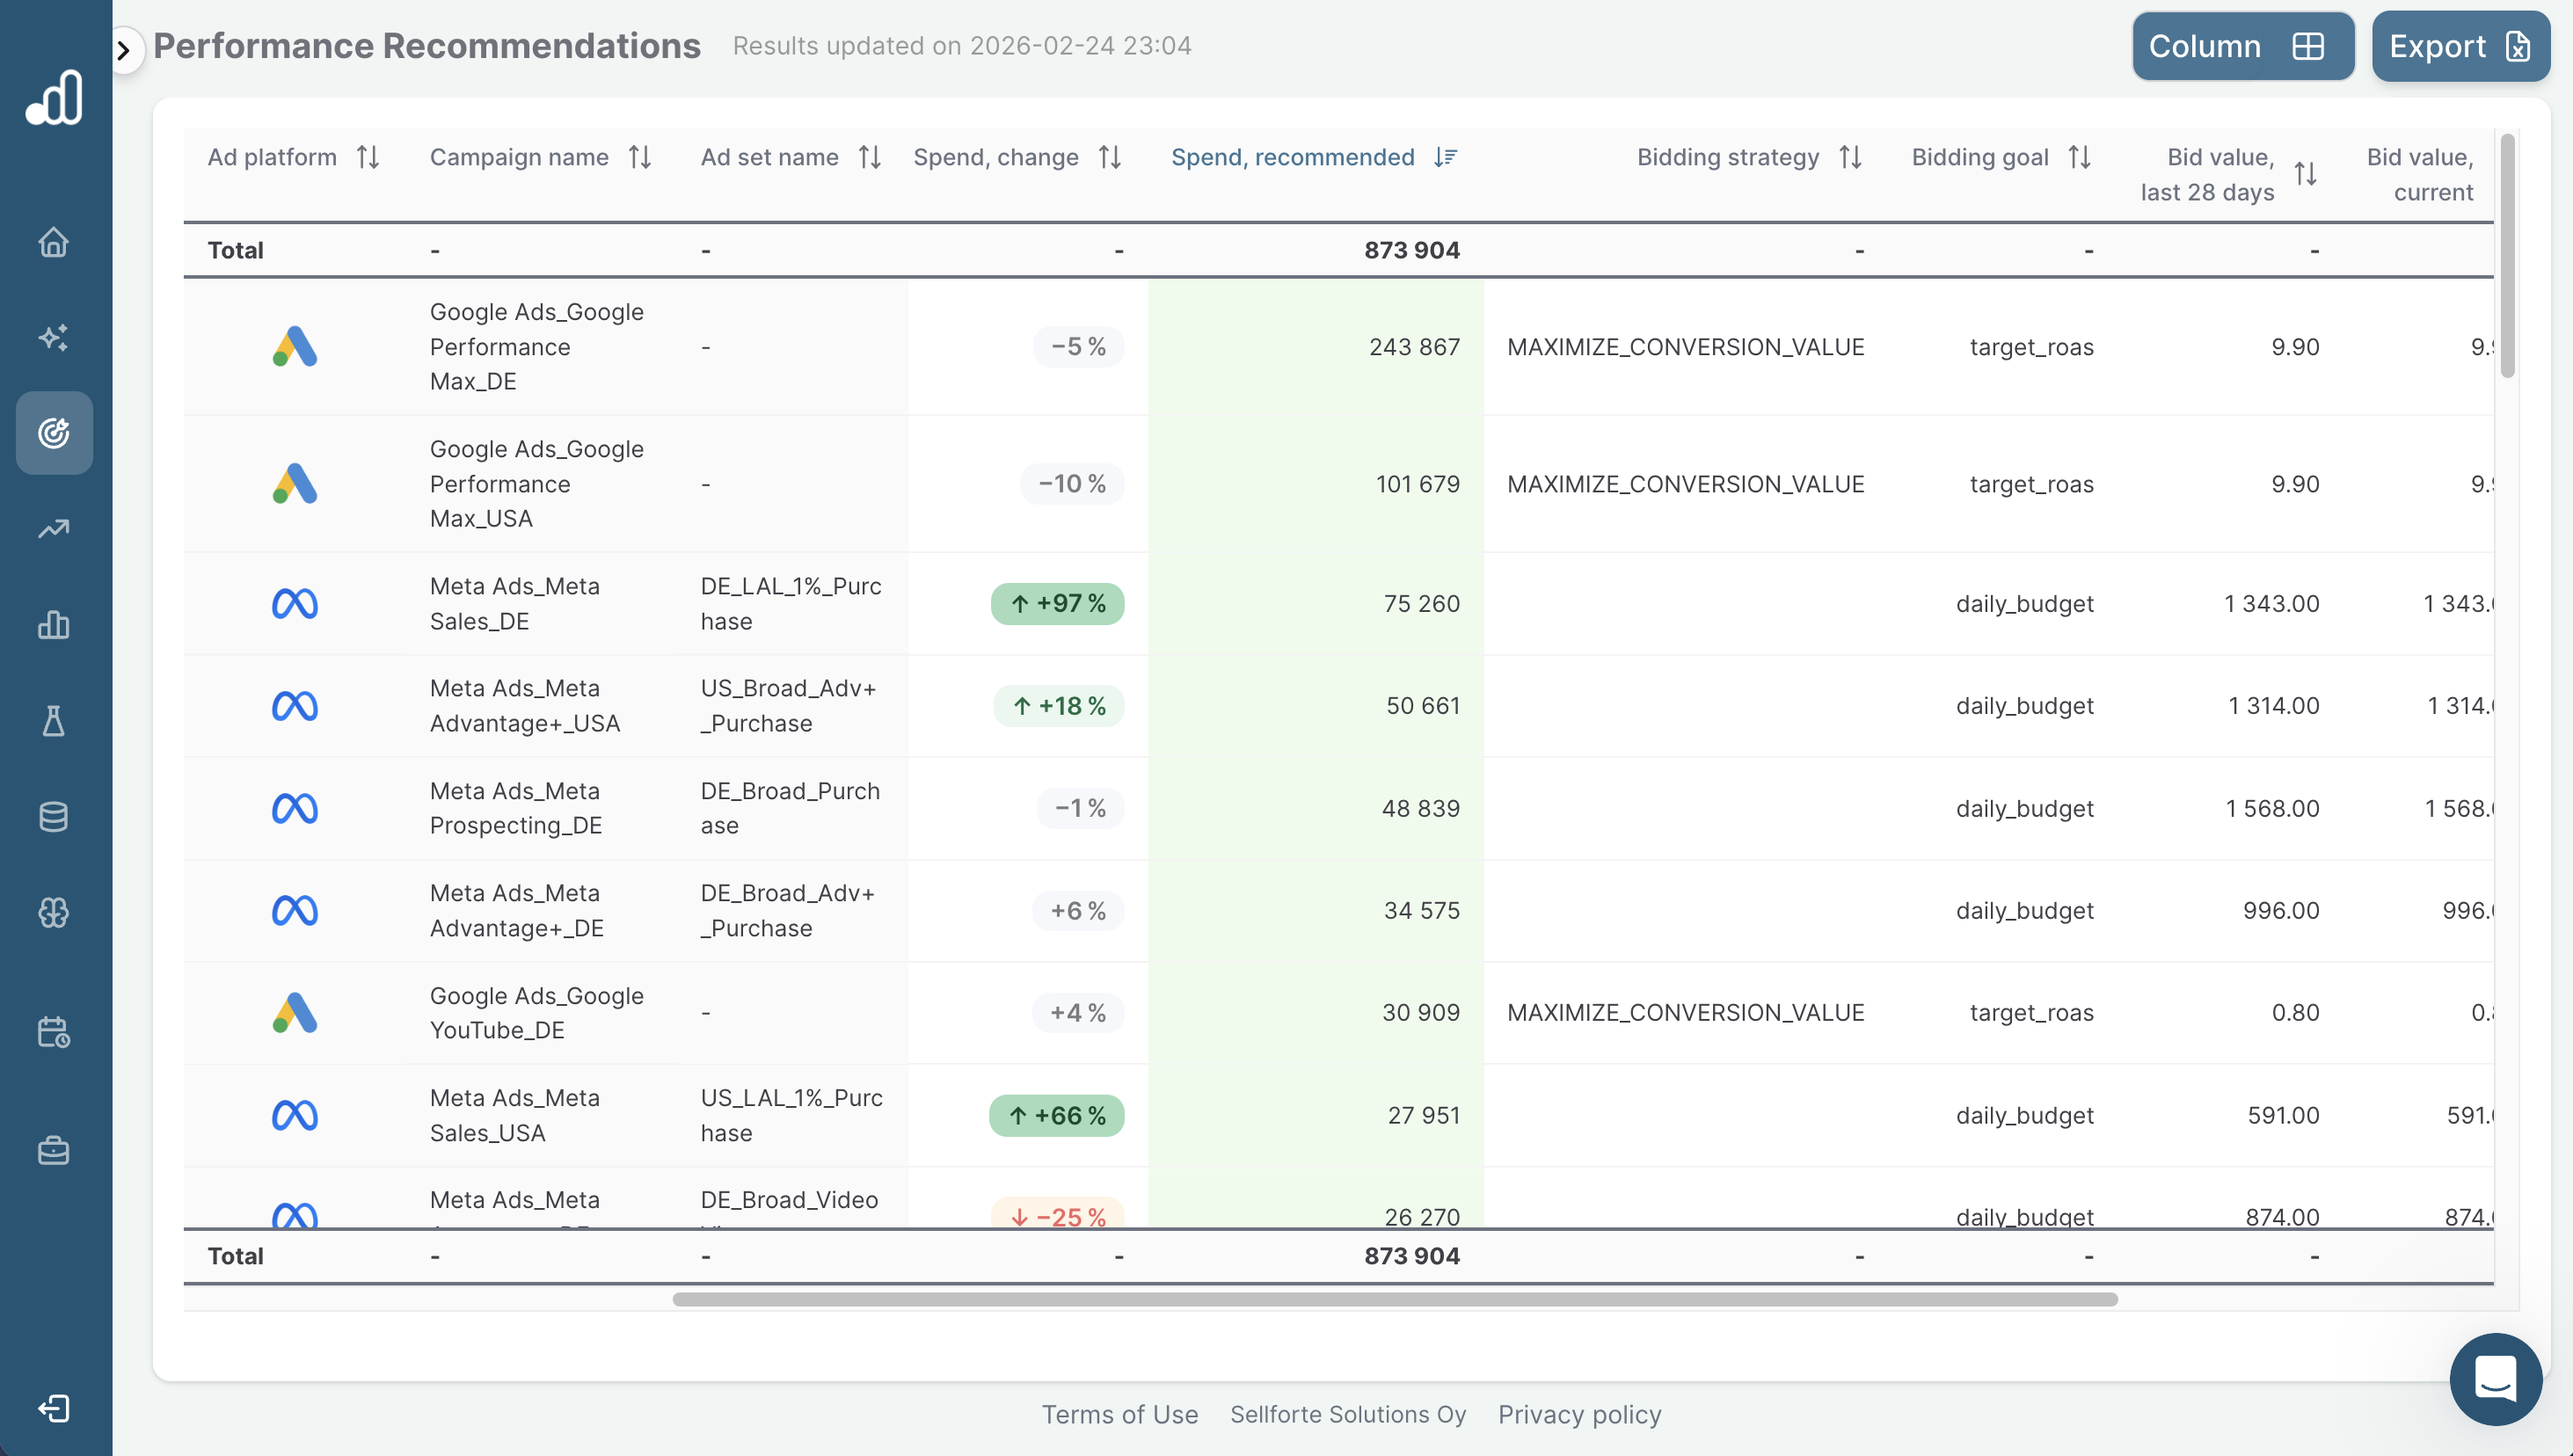
Campaign-level optimization with Next Gen MMMs is exciting, because it enables performance marketing teams to finally transition from MTA, last-click and other attribution methods to incrementality-based optimization.
Lever 2: Optimize spend allocation across advertising channels
The most known MMM use-case is optimizing spend allocation across advertising channels. “Advertising channel” refers to the level that is one click deeper within ad platforms and advertising channels are also sometimes called "tactics". For example,
-
In Meta you have Prospecting, Retargeting, Awareness, Sales, Advantage+ and so on.
-
In Google Ads you have Performance Max, branded search, non-branded search, display, shopping and so on.
Despite being the most common use-case, optimizing spend allocation across channels is the smallest out of the three levers in our research. The +1.6% revenue increase opportunity for ecommerce and DTC businesses comes from decreasing or stopping channels with poor performance or high level of saturation and shifting spend to channels which have room to scale. Below is an illustration of advertising channel optimization with MMM.

Lever 3: Optimize budget pacing throughout the year
The third optimization lever, budget pacing, ensures that advertising spend is distributed optimally across weeks, preventing for example overinvestment when demand is naturally low and underinvestment when there’s high level of natural demand. Below is an illustration of what optimization outlook can look like for this lever:

What’s wrong with today’s measurement?
The previously mentioned improvements mean that an Omnichannel retailer with $1.2B of annual revenue gets a $19M+ revenue increase.
This is a massive improvement. How is it possible that the current budget are so far from optimal? The single-biggest reason is that digital spend optimization today is primarily done with click-based attribution. As an example, to get the true ROI of Meta Advantage+ campaigns, you might need to multiply Google Analytics 4 -reported ROAS by 7x (based on our research).
📊 See how MMM works in practice
→ Get a 30-minute sample model walkthrough
How does Marketing Mix Modeling work?
Marketing Mix Modeling uses statistical regression on historical time-series data to estimate how different marketing activities and external factors (like seasonality or pricing) contribute to sales or other business outcomes.
To understand how Marketing Mix Modeling work in more depth, we need to approach it in three layers:
- General concept: All Marketing Mix Models are based on time-series analysis.
- Bayesian modeling: 80%+ of Marketing Mix Models nowadays are based on a specific time-series analysis method: Bayesian Marketing Mix Modeling.
- Model calibration: Only a few MMM platforms, like Sellforte, are Next Gen MMMs, because they leverage advanced modeling methods, such as model calibration, for radically higher quality MMM results.
Let's now walk through each of the layers.
1. How Does MMM work: The General Concept of time-series analysis
All Marketing Mix Models are time-series models. The MMM is given data on sales, media activities, and other factors influencing sales, such as promotions and the Marketing Mix Model uses this data to learn each media channel's sales impact by investigating whether increases in sales coincide with media activities, as illustrated below.

In this illustration, the company activated campaigns on Meta’s platform, which resulted in a sales increase (first peak). On the second sales peak, the company also activated campaigns in Google’s channels, and the sales was even higher.
Because the model learned Meta’s effectiveness already from first sales peak, it can estimate impact of Google ads during the second peak, even when Google and Meta ads are active at the same time.
While in reality modeling is much more complex, this illustrates the basic idea of estimating incremental impact of media based on time-series data.
2. How does MMM work: Bayesian Marketing Mix Modeling
Bayesian Marketing Mix Modeling, used by 80%+ of MMM vendors and practitioners today, is the golden standard for Marketing Mix Modeling. Bayesian MMM was originally popularized by Google Research in 2017 (see e.g., link), and it has several benefits over legacy models.
Compared to legacy models, Bayesian models produce more robust ROI estimates with limited data, are better at handling uncertainty, and can better manage challenges related to overfitting.
In addition, one of the main benefits of Bayesian MMM is its ability to take in prior knowledge of media behviour before the modeling has started. This knowledge is given to the model in the form of prior distributions, which indicates the likely range of channel’s ROI to the model.
3. How does MMM work: Model calibration, the Next Gen MMM superpower
Model calibration in MMM is only used extensively by the most advanced MMM platforms. Model calibration significantly improves the ROI estimates for individual channels, but also improves the model’s stability as a whole. Model calibration started slowly gaining popularity in 2023, after Igor Skokan et al. launched their ground-breaking article in Harvard Business Review.
In model calibration, traditional modeling data is complemented with other information about media effectiveness, such as geo lift experiments, conversion lift studies, A/B tests, or benchmarks based on attribution data.
Instead of using non-informative priors, e.g., “ROI can be anything between 0 and 100”, model calibration uses informative priors to narrow down the likely ROI range already before modeling, e.g., “ROI is between 4 and 5”.
Below is an illustration of informative priors and non-informative priors in Marketing Mix Modeling.

The main assumption in model calibration is that you have strong evidence, which justifies using prior distributions that limit the range of possible ROI estimates. This makes model calibration tricky - you need to be REALLY SURE that the priors given to the model are based on solid evidence.
Most advanced MMM solutions achieve this by having a systematic method for generating informative priors (i.e., likely ROI distributions) for each channel based on a broad set data. For example, Sellforte’s method ingests
- Experiment data: Conversion Lift Tests, Geo Lift Experiments, and other incrementality tests.
- Attribution data: Google Analytics 4 last-click and DDA, Ad platform attribution, and Multi-Touch-Attribution data.
None of the this data can be used directly as priors in the model without processing. Especially attribution data is highly biased, and requires heavy corrections before it can contribute to the formation of the prior distribution. This is why the model calibration system needs to have specialized processing for each type of input data. For example, Sellforte has specialized processing of Geo Lift experiments to truly understand each experiment’s uncertainty intervals and estimated lift.
By now, you have in-depth understanding of how Marketing Mix Models operate! But what do Marketing Mix Models actually generate as output? Let's cover that next!
What are the main outputs from Marketing Mix Modeling (MMM)?
Marketing Mix Modeling has four key outputs:
- Decomposition of sales to base, media-driven sales and promotion-driven sales
- ROI for each channel, campaign and ad set
- Response curves
- Maginal Incremental ROAS (miROAS)
Let’s walk through each of these one by one.
1. Decomposition of sales to its drivers: base, promotion, media
Marketing Mix Model estimates how much of company's sales was
- Base sales (sales the company would get without media or promotions),
- Incremental sales driven by each channel.
- Promotion-driven sales,
- Other non-media drivevrs, such as weather
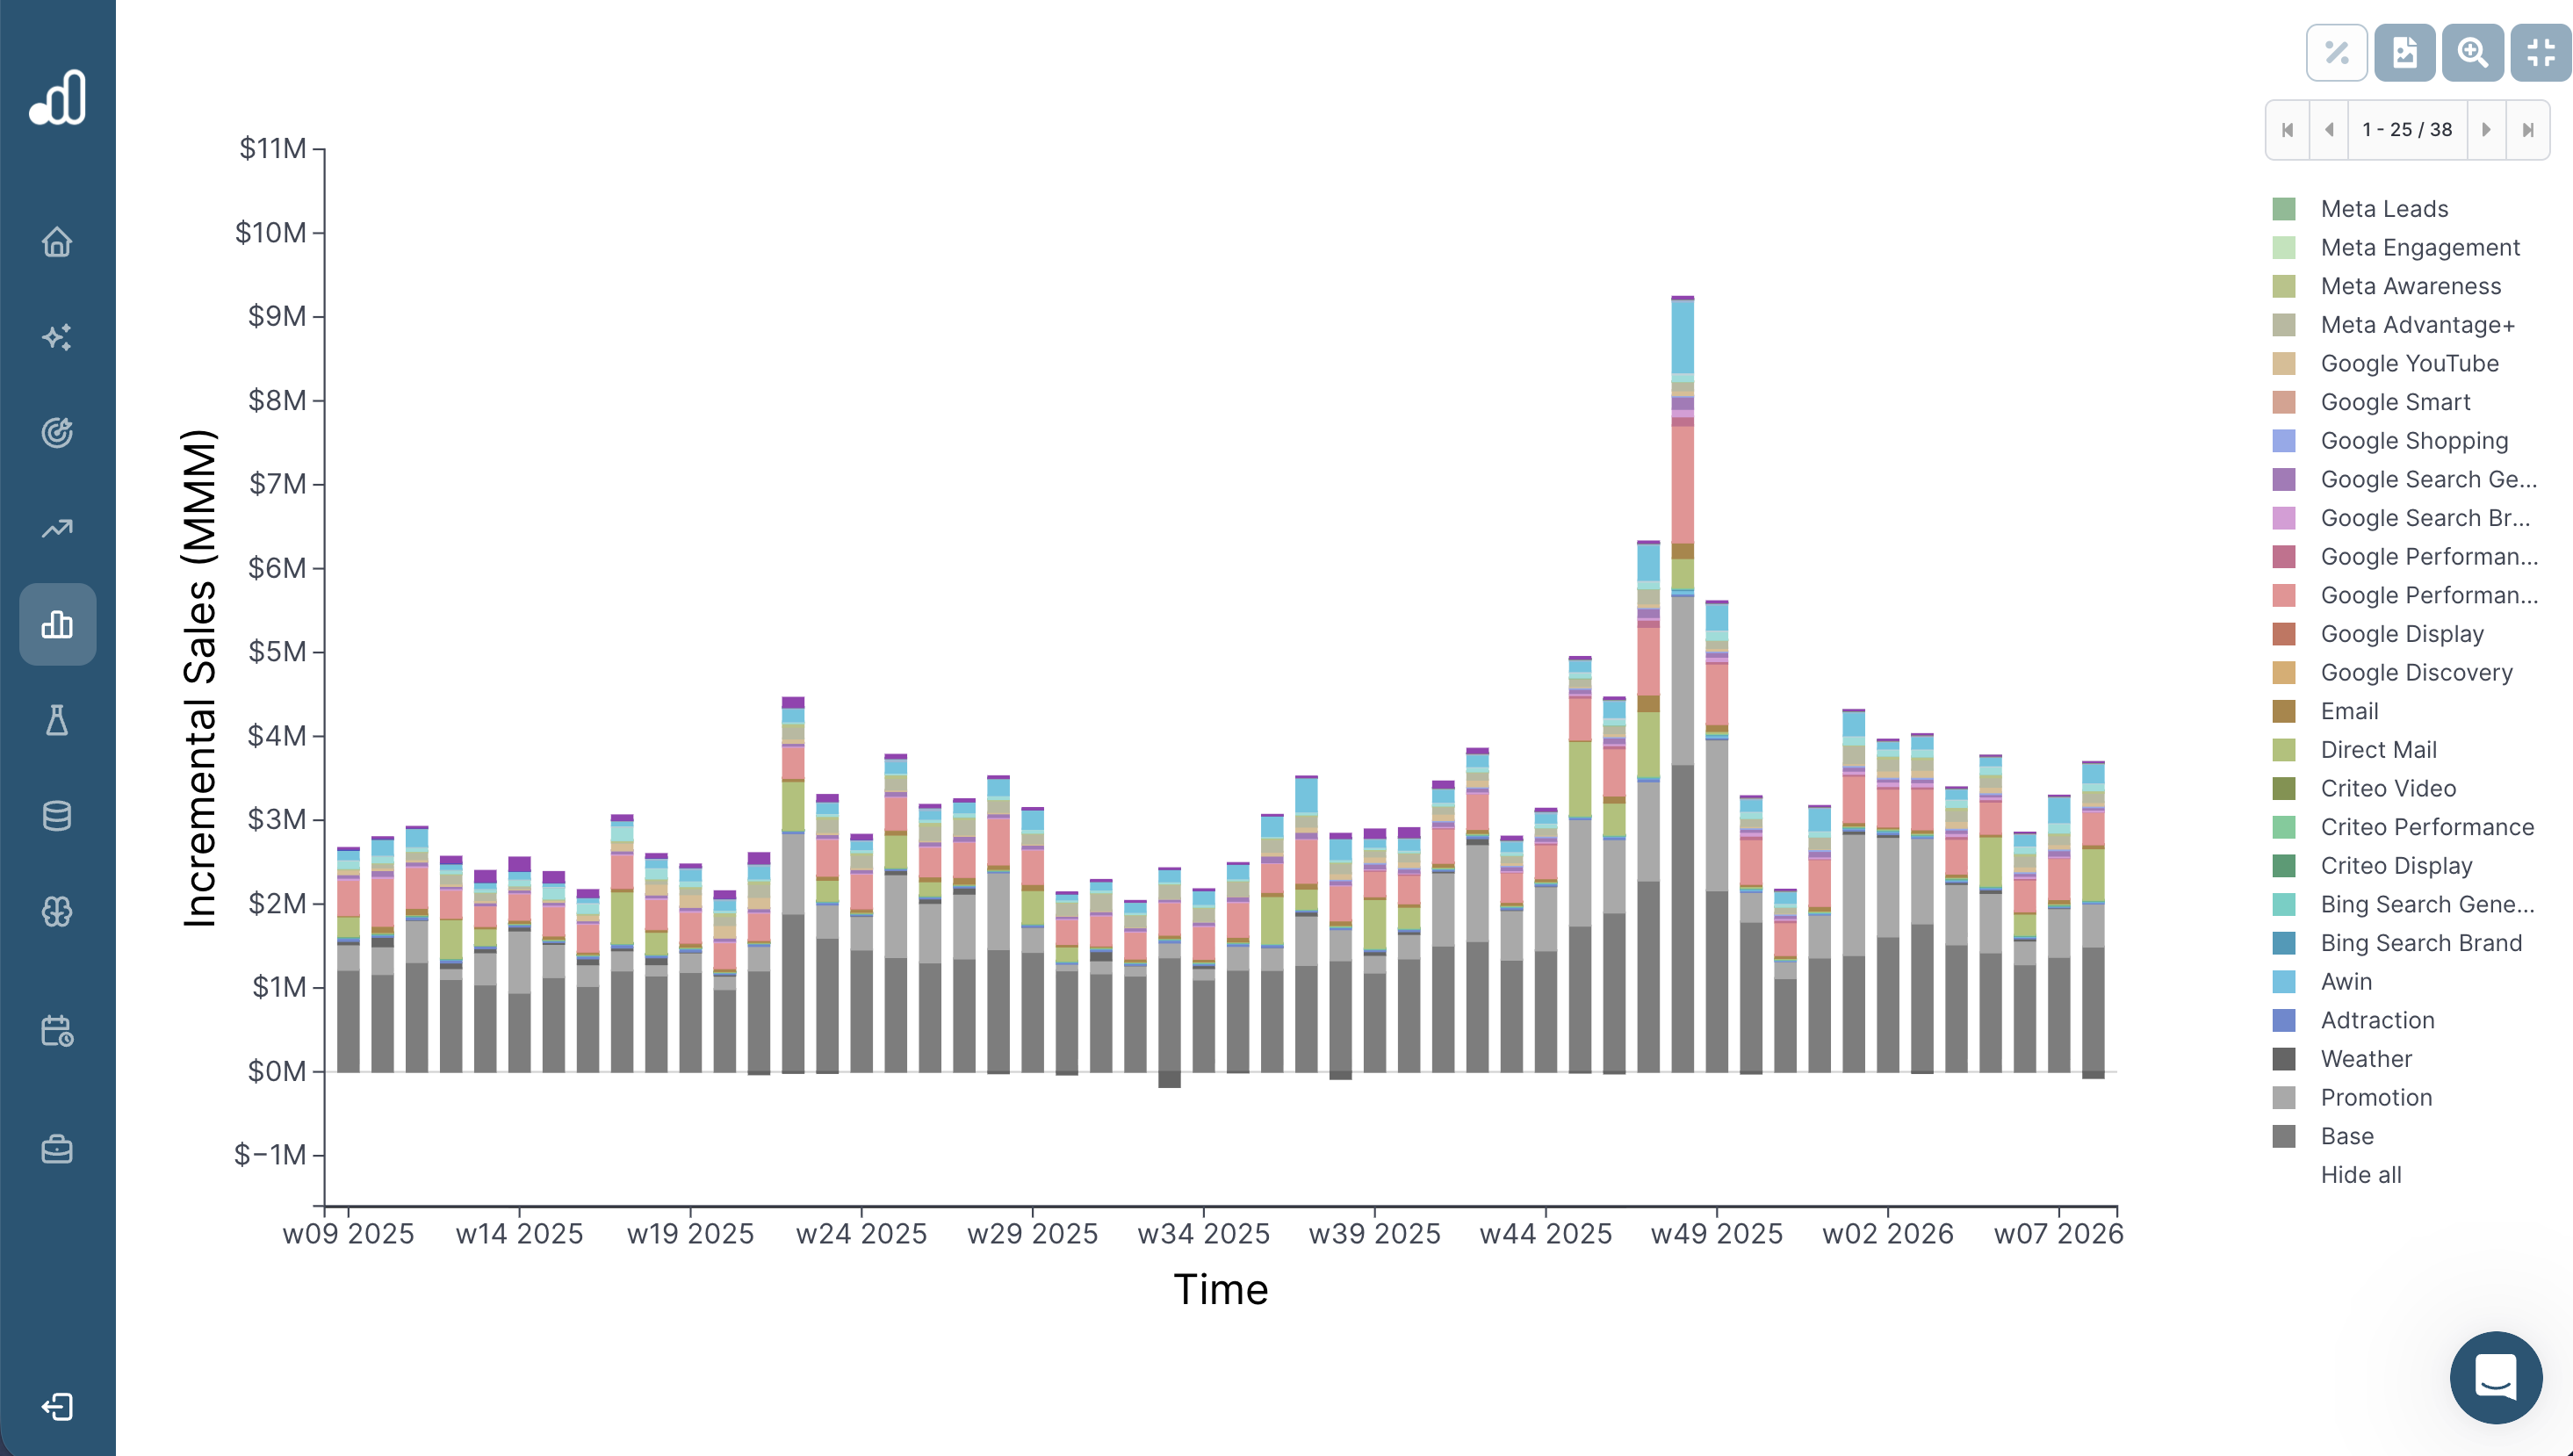
This is typically summarized in a sales decomposition chart, which can be used to understand how impactful marketing activities have been. Below a sales decomposition chart example in Sellforte:
2. ROI of each digital channel and offline media
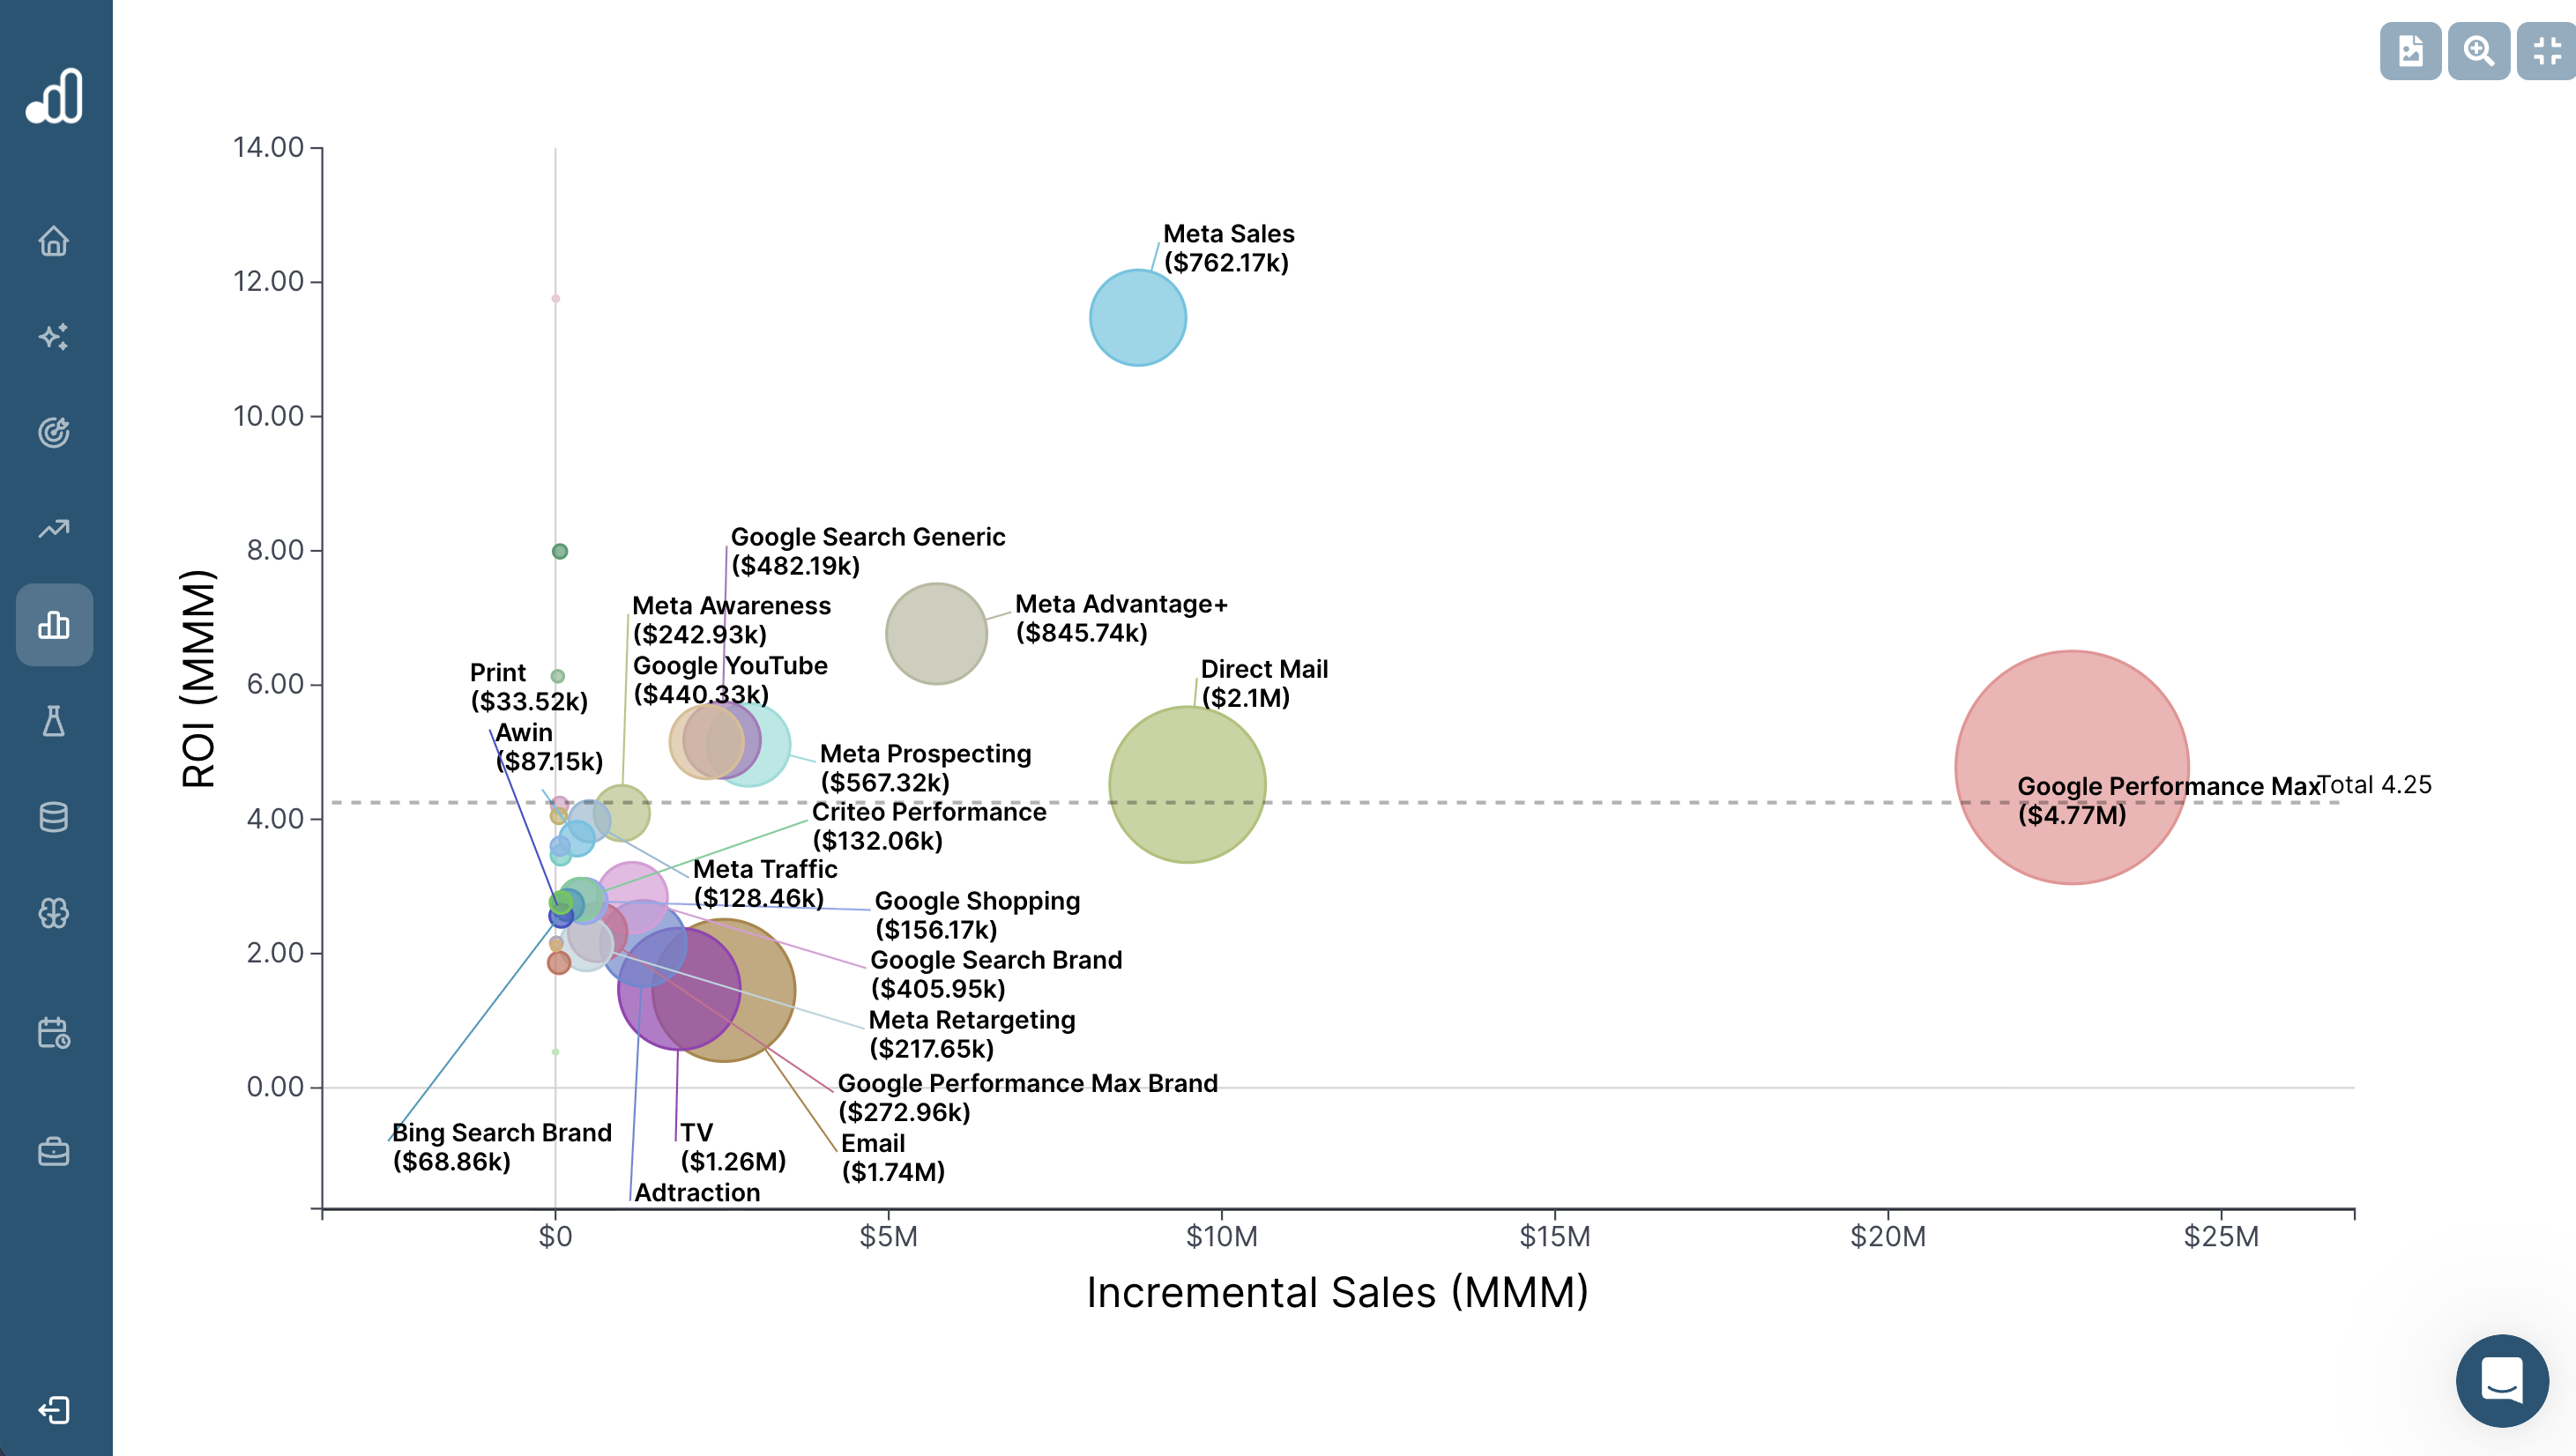
After Marketing Mix Model has estimated the incremental sales impact of each channel and campaign, it can calculate the Return On Investment (ROI) for them. ROI provides an answer to the questions: “If I invest $1 in media, how many dollars do I get back in revenue or margin?” The screenshot from the Sellforte platform below shows one way of summarizing ROI, spend, and incremental sales of each channel.
3. Response curve for each digital channel and offline media
Now it starts getting interesting, because we are getting closer to optimization. Marketing Mix Modeling provides you with response curves for each channel, which indicate the expected the sales impact of a channel at a certain spend level. Response curves capture the diminishing return effect of marketing: the sales impact of each additional euro/dollar invested to a channel decreases the more you invest into the channel.
Response curves are powerful, because they enable you to analyse the level of saturation in each channel. For example, if you’re getting additional budget and evaluating how to invest it, your decision should not be based on ROI comparison – it should be based on understanding which channel has most room to scale. You might have channels with high ROI, but highly saturated, and channels with lower ROI but lots of room to scale.
As an example, below is an image with response curves for two channels. Channel B has higher ROI, but is more saturated. Channel A has lower ROI but room to scale. This means that additional investments in channel B bring very little incremental sales, while channel A can deliver more incremental sales with additional investments.

4. Marginal Incremental ROAS (miROAS) for each channel, campaign and ad set
Response curves enable calculating Marginal Incremental ROAS (miROAS) for each channel and campaign.
miROAS measures the return for the next spent dollar. It provides an answer to the question: If an additional dollar is spent on the channel, campaign or ad set, how much additional revenue will it drive?
miROAS is dependent on the current spend level for the specific marketing activity:
-
With low spend, you have room to scale, and miROAS can be high.
-
With high spend, the channel starts to saturate, and miROAS starts to decrease.
MMM calculates miROAS as a derivative or the slope of the response curve, as illustrated in the image below:

What data do Marketing Mix Models use?
Marketing Mix Models take in three types of data:
- Time-series modeling data:
- Sales data
- Online media data
- Offline media data
- Own media data
- Promotion data
- External variables
- Attribution data
-
Experiment data
Let's discuss these one by one.
1. MMM data inputs: Time-series Modeling data
Sales data. Sellforte gets sales data typically with data connectors/integrations directly from an ecommerce platform, such as Shopify, or from a data warehouse, such as Snowflake. Using data connectors enables automated data flows, and getting the most granular sales data possible (daily, product group -level, geo details etc.)
Online Media Data: Sellforte has in-built data connectors to all significant ad platforms, including Google, Meta, TikTok, Pinterest, Snapchat and so on. This way Sellforte’s model can leverage all relevant metrics, such as like impressions, clicks, conversions, conversions values, and ad spend across your campaigns and channels.
Offline Media Data: This includes traditional advertising like TV, radio, print, and billboards. Marketing Mix Model needs media-specific metrics such rating points, how long the campaigns ran, and how much you spent.
Own Media Data: This is all the data from your own channels, such as SMS and emails.
Promotional data: Promotions are typically major sales drivers, and information about them is important to give to the model.
External Variables: Typical external variables include weather, macroeconomic factors, and data related to seasonal effects.
2. MMM data inputs: Attribution data
Attribution data is important in calibrating the Marketing Mix Model. Typical attribution data that Next Gen MMMs use include the following.
Google Analytics 4 (GA4): GA4’s last-click is the most used attribution method, while some might also use GA4’s data-driven attribution.
Multi-touch-attribution (MTA): MTA as a technology has been in decline for some time, but it is still used especially by some of the largest advertisers.
Ad platform attribution: Ad paltform attribution data can be collected with the same dataconnectors that are used to collect advertising data from the platforms.
3. MMM data inputs: Experiment data
Data on experiments or incrementality tests is also used in calibrating the Marketing Mix Model. However, experiment data is typically not available for all channels, and there’s businesses who haven’t even started conducting experiments. There are two main types of experiments that are popular while writing this article.
Conversion lift tests. Conversion lift tests are offered by most ad platforms, and include for example Meta’s Conversion Lift test, Google’s Conversion Lift test, TikTok’s Split test. Their test setup resembles randomized controlled trials (RCTs), which are typically considered one of the best methods for estimating causal effects. The main idea in conversion lift tests is to divide the target audience into test group and control group, and derive insights about marketing’s incrementality by comparing the two groups. Typically, the test group sees the specific ad to be tested, and the control group sees a blank space.
Geography-based Lift experiment (or Geo tests): Geo tests use a similar concept of creating control and test groups, but here we are talking about geographies. For example, you could divide U.S. states or U.S. Designated Market Areas (DMAs), into test and control areas. While conversion lift tests typically produce standardized outputs that include estimated value and its confidence intervals, geo tests can be more challenging to analyze, as the method lacks a similar level of standardization. For this reason, Sellforte’s MMM platform has in-built capabilities for analysing Geo tests so that they can be used in model validation and calibration.
How to Implement Marketing Mix Modeling?
Marketing Mix Modeling implementations have four steps:
- Connecting Data
- Data Processing
- Modeling, including model calibration
- Spend optimization
Step 1: Connecting Data
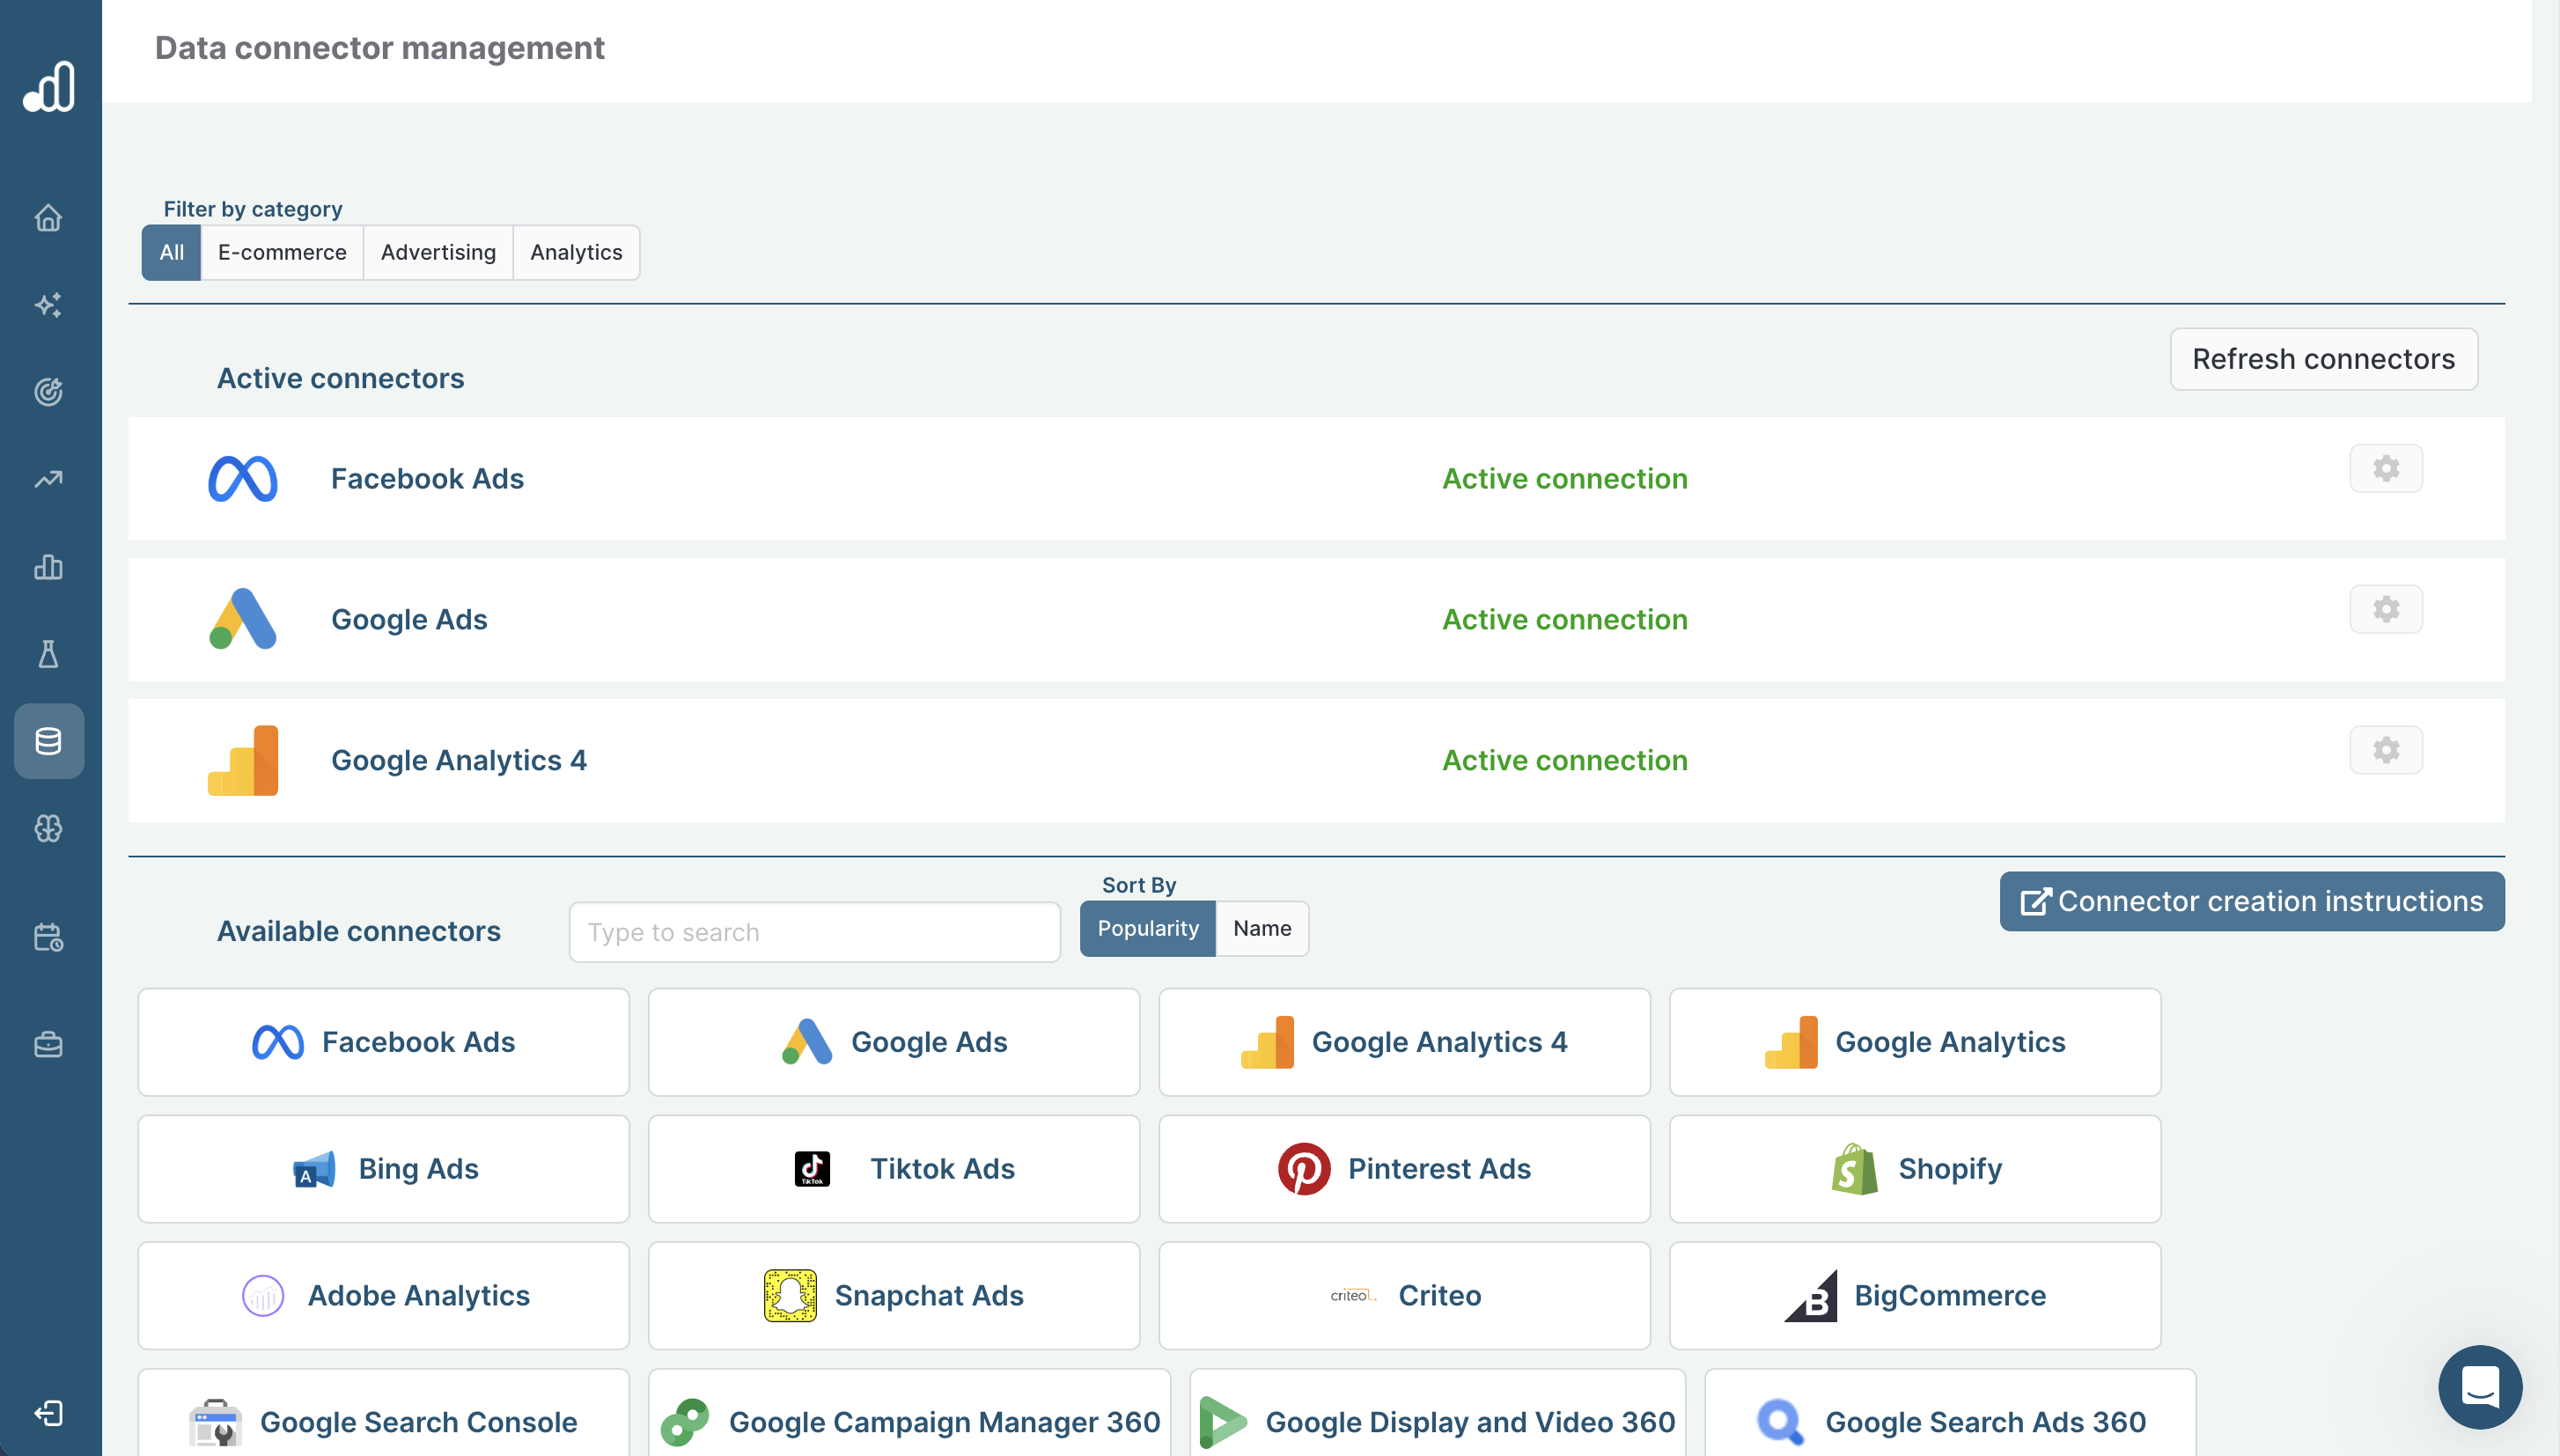
Data collection in Marketing Mix Modeling used to be a manual and labour-intensive task, but nowadays Marketing Mix Modeling platforms have in-built data connectors, that automate data deliveries.
As an example, for medium-sized ecommerce & DTC business, data onboarding takes only 15-30mins where the customer connects their data.
Below is an example of Sellforte’s data connector view:
Step 2: Data Processing
Once the data has started flowing, it needs to be processed to be usable by the Marketing Mix Model. Data processing includes data harmonization, campaign mapping & linking, mapping data to standard media hierarchy, data validation, data cleaning, and many other processing steps.
Modern MMM solutions do these automatically out-of-the-box, without work need from the customer.
Step 3: Modeling, including model calibration
In step 3, the model calibration inputs are prepared, the model is run for the first time and iterated upon. Modern measurement solutions do this automatically.
Step 4: Spend Optimization
Once the modeling results are available, it time to start optimizing. The marketers can start optimizing channel allocation or conduct more granular spend reallocation on the channel and ad set level.
AI Agents in MMM: How are AI Agents influencing MMM?
AI Agents are today found in the most advanced MMM solutions. As an example, below are the agents Sellforte has announced:

Agentic MMM is driving a transformation in three distinct areas.
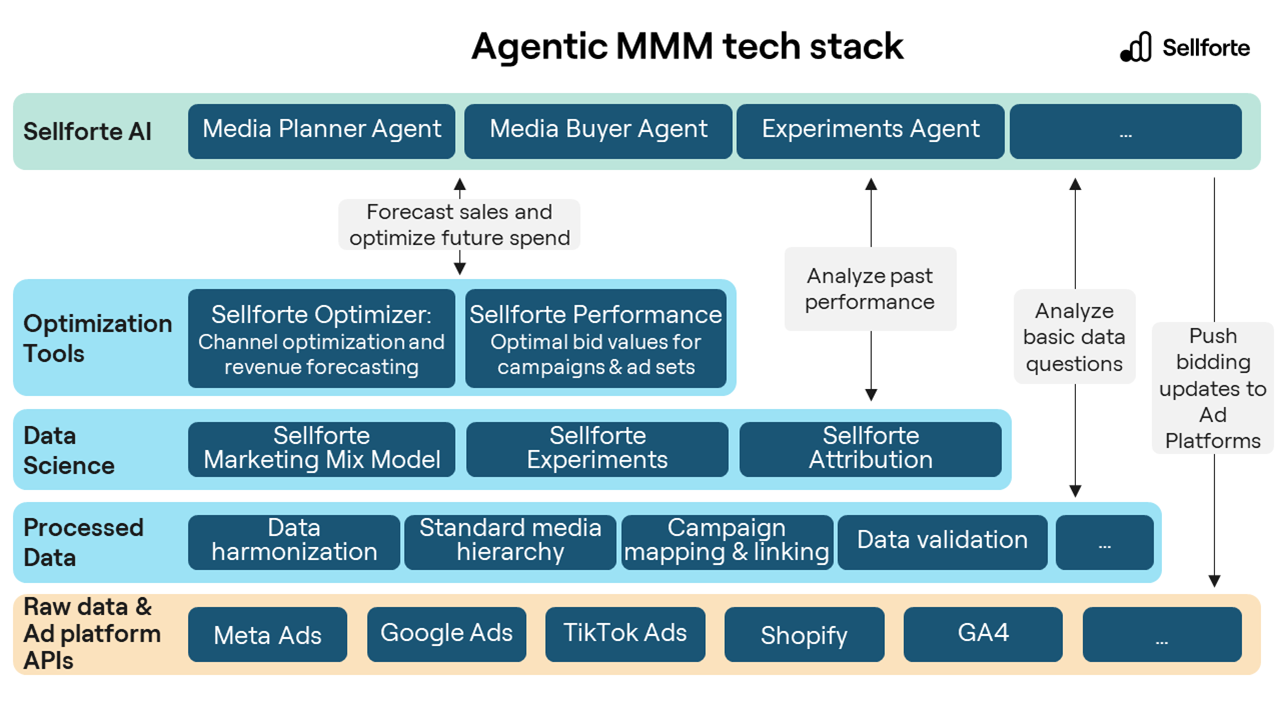
Agentic MMM brings A New layer to the MMM technology stack
Instead of replacing the analytical layers, AI agents are a new layer in the MMM technology stack. When conducting their tasks, AI Agents operate the analytical layers. As an example, when the Media Planner Agent needs to provide an optimal spend allocation across channel, it will interface with an optimizer tool. Below is an example of Sellforte's technology stack.
Agentic MMM Brings A New Interaction Model
Agentic MMM brings a more natural interaction model via a chat interface. Marketers no longer need to learn complex dashboards. They can simply ask, "How should I allocate my budget next month to hit my revenue target?" As an example, below is a screenshot from Sellforte's AI interface with an active discussion on sales forecast.

Agentic MMM Increases MMM's Value through Automation
Beyond ease of use, AI Agents are increasing the tangible value marketers get from MMM by automating workflows. We are moving toward Media Buying Agents that can automatically buy media based on the specific objectives and constraints you provide.
This shifts the marketer's role from manual execution and spreadsheet tinkering to strategic oversight: setting the goals and letting the Agents handle the optimization.
How to choose a Marketing Mix Modeling tool or platform?
Sellforte’s Buyers Guide to MMM Tools and Platforms provides a full in-depth explanation of what to look for when evaluating Marketing Mix Modeling tools or platforms. Below you'll find the summary with icon ✅ indicating a basic feature in most MMMs, and icon 💎 indicating features you typically find from most advanced MMM platforms, Next Gen MMMs.
1. Choose an MMM Platform That Helps You Drive More Sales
Your first objective is to ensure that the Marketing Mix Modeling solution has optimization capabilities that help you drive more sales. Here's a checklist from basic features to Next Gen features:
Basic features:
✅ Advertising channel-level optimization
Next Gen MMM features:
💎 Campaign-level optimization
💎 Optimal weekly budget pacing
2. Choose an MMM Platform That Produces High Quality Results
When you’re confident that the platform you’re evaluating has the right optimization capabilities, it’s time to check whether you can trust the Marketing Mix Modeling results enough to start acting based on the recommendations.
I’ll be honest with you: there’s a lot of Marketing Mix Models generating low quality, non-sensical, modeling results in the market. Why? Generating MMM results is easier than ever before, for example with open-source modeling libraries like Meridian and Robyn. Today, it can even be done by a non-technical person without knowledge of statistics or econometrics, just by following simple tutorials. At the same time, the challenge of building MMMs that produce high quality results has remained, because MMM datasets are noisy and can have strong multicollinearity effects that need to be managed, as Google Research pointed out already in 2017.
Luckily, there’s a few things you can easily check from any MMM vendor, that make it likely that the MMM produces high quality results. Here's a checklist from basic features to Next Gen features:
Basic features:
✅ Statistical model validation
✅ Bayesian approach
Next Gen MMM features:
💎 MMM is calibrated with informative priors
💎 Systematic method for generating informative priors from experiments and attribution data
💎 Advanced model validation based on model outputs
3. Choose an MMM platform that is easy to test & start with
Now that you're convinced that you have an MMM, which helps you with the right optimization decisions and produces high quality modeling results, you should evaluate the effort of getting started with the platform. This is a topic we at Sellforte are especially passionate about - making MMMs easy to use and start without compromising quality of MMM results. Here's a checklist from basic features to Next Gen features:
Basic features:
✅ Data connectors
Next Gen MMM features:
💎 Delivers high quality results in 1-2 weeks
💎 Provides a Free Trial
4. Other considerations
Build or Buy. If you are in a position where you have the capabilities and financial muscle to invest millions of dollars to build a Marketing Mix Modeling platform described in this article, as well as patience to wait for its development, consider yourself lucky - you are in a unique situation! While building an own MMM platform gives you the ultimate freedom and flexibility, most companies decide to purchase subscription to an MMM platform from a specialized vendor, after evaluating the cost and effort of building and operating an MMM platform themselves.
Consulting projects or SaaS. Since Sellforte was founded in 2017, we've witnessed a major transition from consultant-delivered MMM PowerPoints to modern SaaS tools. If you're still considering MMM consulting projects today, you should ensure you have a strong rationale and conviction why your consulting partner can deliver superior service against modern MMM SaaS vendors.
Conclusion and Key takeaways
In short:
- MMM-based on optimization can drive a significant improvement in sales, +6.5% for ecommerce and DTC brands
- MMM technology has advanced to a level where it can support tactical campaign optimization, in addition to higher level budget allocation decisions
- Testing an MMM platform today is fast & easy: Connect your data in 15-30mins, get MMM results in 1-2 weeks (example of an eCom/DTC onboarding)
If you’re interested in testing Marketing Mix Modeling, book a demo with Sellforte.
Further Reading & Resources on MMM
MMM Methdology
- Calibrating Marketing Mix Models with Experiments and Attribution data
- Advertising response curves: What are they and why do you need them?
- What is Causal Marketing Mix Modeling (MMM)?
- Understanding R2 in Marketing Mix Modeling: A Guide for Marketers
- MMM for Ecommerce: How Marketing Mix Modeling (MMM) Works for Online DTC Brands
- What does "Enterprise-Grade" Mean in Marketing Mix Modeling (MMM)?
- What is Incrementality Testing? Guide for Marketers
- Marginal Incremental ROAS (miROAS): What is it? And why does it matter to marketers?
- How Much Ad Spend Is Needed for Marketing Mix Modeling?
MMM, AI and Agents
- The Rise of Agentic MMM (Marketing Mix Modeling): How AI Is Transforming Media Optimization
- State of AI in MMM: Only 13% of MMM Vendors Implementing AI
- Webinar: Agentic MMM in Action: The Future of Autonomous Media Planning and Buying in Real Time
Use-cases: Using MMM to optimize media spend
- 11 Benefits of Marketing Mix Modeling (MMM) Every Marketer Should Know
- 6 Reasons eCommerce & DTC Brands Should Use Marketing Mix Modeling (MMM)
- The Shift in Marketing Mix Modeling: Why Campaign-Level Optimization is Taking Over
- The Five Requirements of Autonomous Media Buying and Optimization: M.A.G.I.C.
- Bid Optimization: How to Calculate the Optimal Bid Values for Your Campaigns Using miROAS
- ROAS, iROAS, miROAS: Choosing the Right KPI for Optimizing Media Spend
Original MMM Research by Sellforte Labs
- The 3 Danger Zones of Last-Click (And How to Avoid Them)
- How to measure Meta correctly? GA4 vs. MTA vs. MMM
- How to Measure the True Effectiveness of TikTok Ads?
- From Last-click to Marketing Mix Modeling (MMM): Unlock +6.5% more sales
- The Missing 24%: Why MMM Without Promotions Behaves Like Last-Click
Practical hands-on MMM guides
- How to Integrate Experiments Into an MMM Platform: A Practical Guide
- MMM Pilot Best Practices: 4 Steps to Plan, Run & Scale Your Marketing Mix Modeling Pilot
MMM tools, MMM software and MMM vendors
MMM tools, software and vendors for Ecommerce
- Best MMM Tools for Ecommerce Brands: Top 10 Software for 2026
- Top 5 Enterprise MMM Software for Large Ecommerce Brands ($1B+ in Sales)
- Top 5 Mid-Market MMM Software for Medium-Sized Ecommerce Brands ($50M–$1B Revenue)
MMM tools, software and vendors more broadly
- 25 Marketing Mix Modeling Tools for Accelerating Growth in 2025
- Meridian vs. Sellforte MMM SaaS: The Complete Comparison for 2026
Review MMM SaaS Product Features
- Visit Sellforte demo (no sign-up required): Sellforte demo
Research papers and whitepapers
- Challenges And Opportunities In Media Mix Modeling (2017, Google - Chan et al.) Link
- Bayesian Methods for Media Mix Modeling with Carryover and Shape Effects (2017, Google - Jin et al.) Link
- Geo-level Bayesian Hierarchical Media Mix Modeling (2017, Google - Sun et al.) Link
- Hierarchical Bayesian Approach to Improve Media Mix Models Using Category Data (2017, Google, Wang et. al) Link
- Bayesian Time Varying Coefficient Model with Applications to Marketing Mix Modeling (2021, Uber - Ng et al.) Link
- Hierarchical Marketing Mix Models with Sign Constraints (2020, Cheng et al.) Link
- Bayesian Hierarchical Media Mix Model Incorporating Reach and Frequency Data (2023, Google - Zhang et al.) Link
- Media Mix Model Calibration With Bayesian Priors (2024, Zhang et al.) Link


Marketing Mix Modeling in 2025: Five Trends for eCom/DTC Brands

Top Marketing Measurement and Optimization Tools in 2025
