A/B Test is an incrementality experiment that measures the causal impact of a marketing activity using data you upload directly. It uses the same Bayesian synthetic control methodology as Geo Lift, but is designed for situations where the experimental data lives outside Sellforte's standard data pipeline.
This article covers what makes A/B Test distinctive, when to use it, how to prepare your data, and how to set one up. For methodology, see Sellforte Experiments: Methodology. For interpreting results, see Sellforte Experiments: How to Read the Results Dashboard.
What makes A/B Test distinctive
Bring your own data
A/B Test is the right choice when the relevant experimental data is not in Sellforte's data pipeline. You upload the data directly in a defined format, and the platform runs the same analysis as Geo Lift on that data. There is no alternative path — A/B Test always requires an upload.
Flexible grouping
Unlike Geo Lift, where groups are always geographic, A/B Test accepts any meaningful grouping. Test and control groups can represent customer segments, product categories, store tiers, geographic areas, or any other split — as long as the treatment is clearly isolated and the data follows the required format.
Media data is optional
You can run an A/B Test with KPI data only. If media data is not uploaded, the analysis produces incremental KPI estimates without an iROAS calculation. This makes A/B Test useful even when spend data is not available or not relevant.
User-runnable
Because the data format is documented and templates are provided, A/B Test can be set up and run by users directly, not just by Sellforte. This makes it a practical option for teams that run their own experiments externally and want to analyse the results inside Sellforte.
When to use A/B Test
A/B Test is usually the right choice when:
- You ran a controlled experiment where some groups received a treatment and others did not, and the data is not in Sellforte
- The treatment split is not geographic — for example, a new versus returning customer split, or a platform-level audience test
- You want to analyse a segment-level experiment with flexible group definitions
- You have KPI data at the group level, with or without corresponding media spend data
- You want to feed results from an externally run experiment into Sellforte for analysis and MMM calibration
When A/B Test may not be the right fit
Consider Geo Lift instead when:
- The relevant data is already available in Sellforte at the right geographic level
- The experiment is geographically structured and can be configured directly in the platform without an upload
Geo Lift avoids the need for data preparation and upload, which reduces friction and the risk of formatting errors.
Data requirements
A/B Test requires you to upload data in a defined format. Two files can be provided.
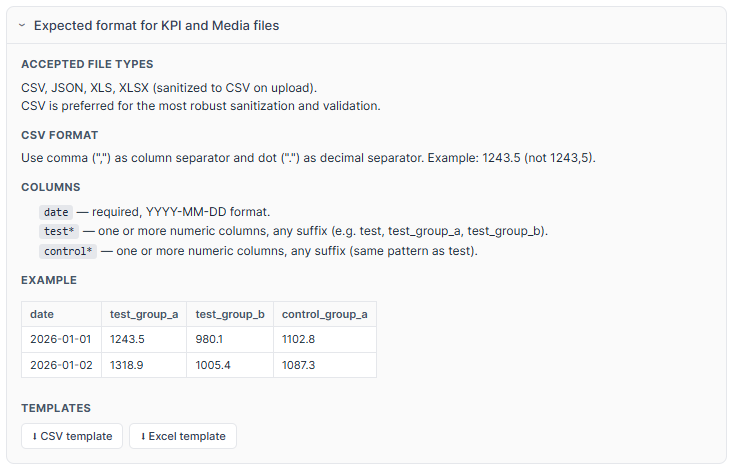
KPI data (required)
Contains the performance metric broken down by group and date.
Accepted formats: CSV, JSON, XLS, XLSX. CSV is recommended.
Required columns:
date— in YYYY-MM-DD format- One or more columns prefixed with
test_(e.g.test_new,test_group_a) - One or more columns prefixed with
control_(e.g.control_new,control_group_a)
Use a comma as the column separator and a dot as the decimal separator. Example: 1243.5, not 1243,5.
Media data (optional)
Contains advertising spend for the test groups, in the same format as the KPI file. When provided, the platform calculates iROAS in addition to the KPI effect.
CSV and Excel templates for both files are available to download from the experiment setup screen under Expected format for KPI and Media files.
How to create an A/B Test experiment
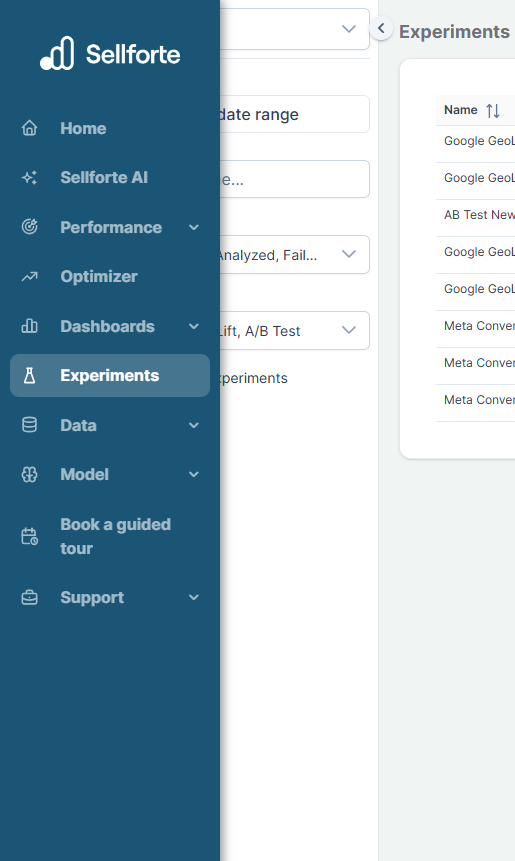
1. Open the Experiments module
From the left navigation menu, go to Experiments. This opens the Experiment Library.
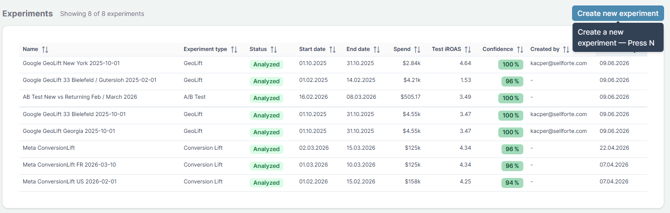
2. Create a new experiment
Click Create new experiment and select A/B Test as the experiment type.
3. Define the experiment setup
Experiment name — Use a structured naming convention, such as channel + segment + date.
KPI data — Upload your KPI file using the file picker or drag and drop. The platform validates the file automatically and confirms when it is ready. If validation fails, an error message will indicate which columns are missing or incorrectly named.
Media data (optional) — Upload your media spend file if iROAS is needed. You do not need to wait for the KPI upload to complete before uploading the media file.
Start and end date — Define the treatment period. Check your data file to confirm the correct dates.
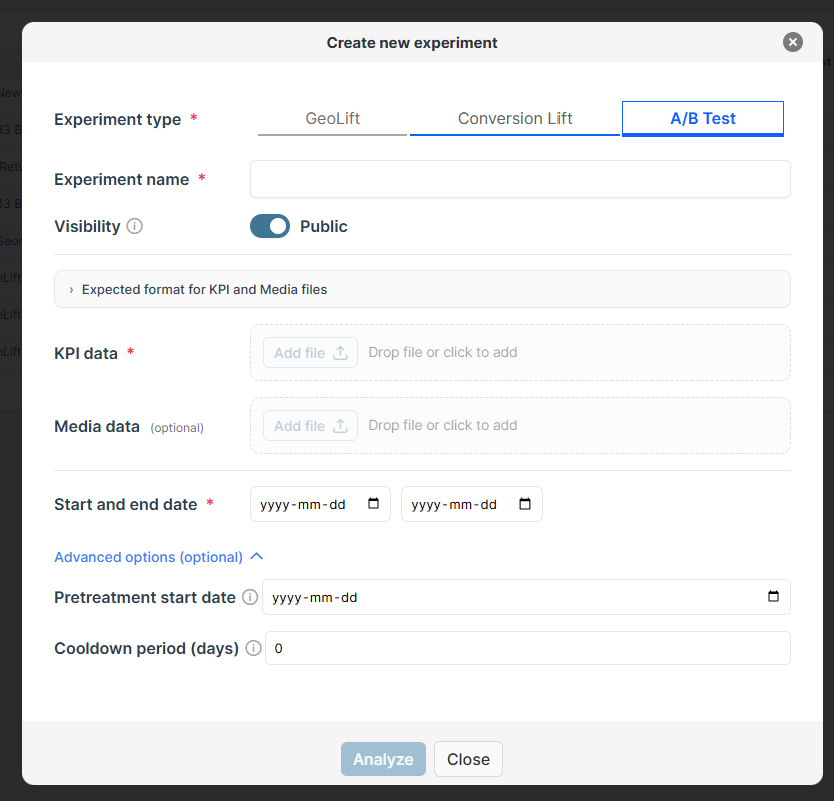
Advanced options. Two optional settings are available:
- Pretreatment start date: limits the pre-treatment window. If left empty, the platform uses the first date in the data.
- Cooldown period (days): extends the analysis window beyond the treatment end date to capture carry-over effects. Set this based on your business context.
4. Run the analysis
Click Analyze to generate the result. Analysis typically completes within a minute. The platform then generates an AI summary automatically.
Working with multiple test groups
If your data includes multiple test groups — for example, new and returning customer segments — the platform aggregates all test groups into a single combined result by default.
For more granular insight, consider analysing each test group separately. This gives the model the best chance to build an optimised synthetic control for each group, and makes results easier to interpret and explain to stakeholders. It also allows you to see how the treatment performed differently across segments.
Analysing at a more granular level generally produces more reliable synthetic controls and more interpretable outputs. If your experiment involves distinct segments, consider running a separate analysis for each one.
Using A/B Test results to calibrate MMM
High-quality A/B Test experiments can improve your MMM in the same way as Geo Lift — by providing real-world ROI anchors and informative priors. Use results with strong R-squared, high confidence, and a clean experimental design. More experiments do not automatically improve MMM — better experiments do.
Best practices:- Download the data templates before preparing your files to ensure the format is correct
- Check your data carefully — the most common cause of analysis failure is incorrect dates or column names
- Use clearly defined test and control groups with no treatment overlap
- Ensure treatment intensity is strong enough to produce a detectable effect
- Set the cool-down period based on your specific business context
- For multi-segment experiments, consider analysing each segment separately
- Document findings and decisions using the comments feature