Blog
Why optimize eCommerce KPIs with MMM? Part 3: Profitability
September 05, 2023 | Juha Nuutinen, Paul Arpikari, Carmen Bozga
As we continue our deep dive into the role of Marketing Mix Modeling (MMM) in eCommerce KPI optimization, our focus shifts from the basic understanding of unit economics to the crucial aspect of maximizing marketing profitability. At the heart of these KPIs is the concept of marketing profitability optimization. In simpler terms, it's not just about how much you're spending, but ensuring that each dollar invested in your marketing efforts is working its hardest for you. It's about stretching that marketing dollar to its maximum potential, ensuring that your ROI isn't just positive, but optimal. While these metrics traditionally fall within the sales domain, their implications extend far into marketing, revealing the true profitability of our marketing efforts.
In the third part of our series on eCommerce KPIs, we'll tackle the following:
- Gross Margin After Returns: Understand the real profit after accounting for product returns, a vital metric in eCommerce given the often-high return rates.
- Gross Margin After Returns for New and Returning Customers: Segmenting by customer type can reveal crucial insights. Are new customers more profitable, or do loyal, returning customers bring more to the bottom line?
- Gross Margin After Returns and Shipping Cost: Shipping is a significant expense for many eCommerce businesses. Here, we'll factor in these costs to truly ascertain the profitability of each sale.
- Adding the Real Country from CRM: Location can significantly influence profitability, especially when considering factors like shipping costs, taxes, LTV of a customer and local purchasing power. By pulling accurate country data from CRM, we can get a more precise view of profitability by region.
Gross Margin After Returns
Gross Margin After Returns stands as a cornerstone metric to truly gauge profitability. Although Google Analytics doesn't provide direct insights into this particular measure, integrating CRM and MMM bridges this gap. By linking the Gross Margin (GM) to every order line, businesses can tap into a detailed understanding of their genuine profits. This specific data is often harvested from your Customer Relationship Management (CRM) platform or Product Information Management (PIM).
The cruciality of this metric is highlighted when we observe the variability in GM percentages across distinct product categories. It's not uncommon to witness GM percentages swinging widely from 20% to a massive 60%. Hence, having a grip on this figure is vital for businesses to shape strategies that ensure sustainable growth and profitability.
Differentiating Gross Margin: New vs. Returning Customers
When considering Gross Margin After Returns, it's essential to differentiate between new and returning customers. To do this effectively, one must connect CRM data with Google Analytics data. This integration allows businesses to have a clearer segmentation between these two customer categories, further informing their marketing strategies.
The importance of this differentiation cannot be overstated. New customers might have distinct purchasing behaviors, preferences, and return rates compared to long-standing, loyal customers. By having a segmented view, businesses can tailor their marketing efforts more precisely. For instance, promotional campaigns or loyalty programs can be adjusted based on the purchasing patterns and profitability of each segment.
Moreover, understanding the gross margin between these groups can shed light on the effectiveness of customer acquisition strategies versus retention initiatives. This insight can guide resource allocation, ensuring that marketing budgets are directed towards the most profitable avenues, whether it's attracting new consumers or nurturing existing relationships.
Factoring in Shipping: Gross Margin After Returns and Shipping Costs
When diving deeper into the intricacies of eCommerce profitability, one cannot overlook the influence of shipping costs on gross margins. To fully capture the landscape of profitability post-returns, it's essential to integrate shipping cost data with GA data. The reason for this integration becomes clear when we consider the fluctuations in shipping expenses. Depending on the specific market – with home markets generally incurring lower costs and overseas shipments being substantially pricier – shipping costs can oscillate between 4-20 USD (or more) per order. Additionally, the nature of the product plays a pivotal role in determining these costs. For instance, while a lightweight item might incur minimal shipping fees, a bulky piece of furniture can substantially increase the shipping cost due to its size and weight. Recognising and accounting for these variables ensures a more accurate grasp on true profitability metrics.
The Real Country Nuance: CRM vs. GA Insights
While Google Analytics (GA) offers a plethora of valuable insights, one area where it falls short is in accurately identifying a user's country of residence. GA determines location based on the user's IP address, which, due to reasons such as VPN usage or shared IPs, might not always be indicative of the user's actual geographical location. Contrastingly, the Customer Relationship Management (CRM) system provides a more reliable source for this data. Within the CRM, location data is typically gathered from user profiles, shipping addresses, or billing information, thus offering a more precise representation of the user's real country. This distinction is crucial, especially when tailoring marketing strategies or analyzing regional sales data, as understanding the genuine demographics can lead to more informed business decisions.
How do these KPIs interact?
The KPIs we mentioned so far all interact and influence each other. Here is a breakdown of their relationship:
Gross Margin After Returns & Gross Margin After Returns for New and Old Customers:
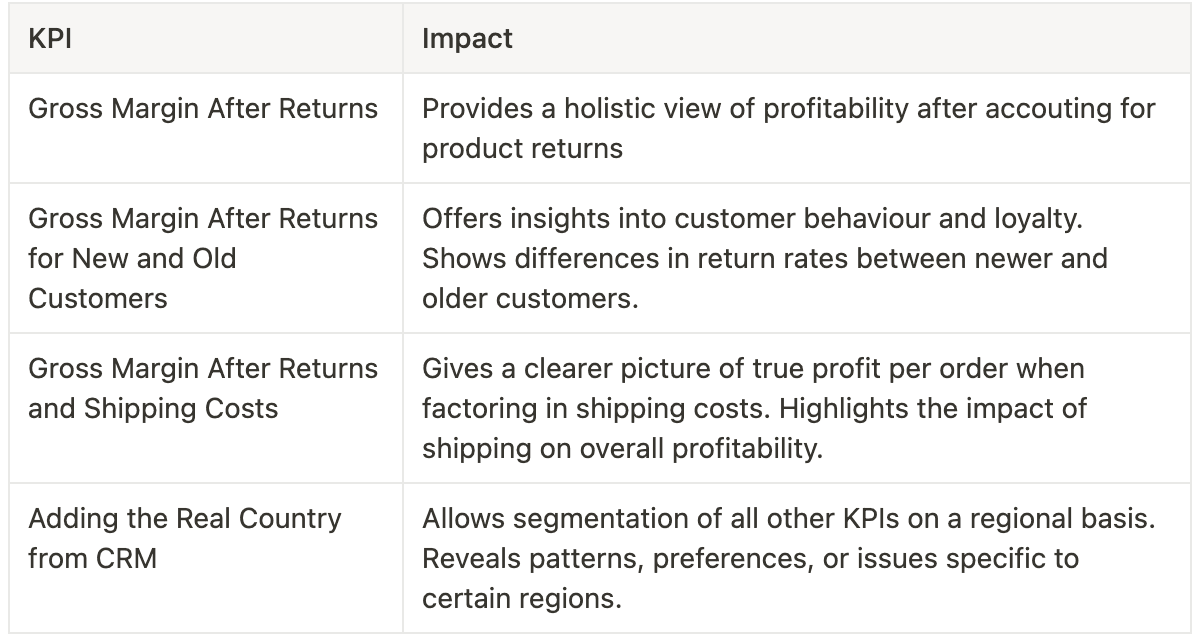
- These two KPIs are closely related. The overall gross margin after returns provides a holistic view of profitability after accounting for product returns. When segmented for new versus old customers, it provides insights into customer behavior and loyalty. Returning, loyal customers might have lower return rates than newer customers, indicating higher trust or familiarity with the product. Alternatively, new customers might be testing the waters and could have a higher return rate, which can be used to improve customer onboarding or product information clarity.
Gross Margin After Returns & Gross Margin After Returns and Shipping Cost:
- After understanding the profitability post-returns, adding shipping costs gives a clearer picture of the true profit per order. If a business has a high return rate and high shipping costs, this could severely impact profitability. Shipping costs can sometimes be overlooked, but they play a crucial role, especially in businesses with a significant number of overseas shipments or heavy/bulky items.
Gross Margin After Returns and Shipping Cost & Adding the Real Country from CRM:
- When combined, these KPIs can pinpoint regions/countries where the company is either more profitable or is incurring more costs. By knowing the actual country from the CRM, businesses can make more informed decisions on shipping policies, pricing, or even marketing strategies for specific regions. For instance, if a particular country has high shipping costs but also high return rates, strategies can be implemented to either reduce returns or adjust pricing in that region.
Adding the Real Country from CRM & All Other KPIs:
- Knowing the real country allows businesses to segment and analyze all other KPIs on a regional or country-specific basis. This segmentation can reveal patterns, preferences, or issues specific to certain regions. For instance, a product might be more popular in one country and have a lower return rate, suggesting cultural or market preferences. Conversely, high return rates in a specific country might indicate logistical issues, cultural mismatches, or even issues with local marketing campaigns.
In essence, while each KPI provides valuable insights on its own, their true power is harnessed when analyzed in conjunction. They offer a multi-dimensional view of business performance, highlighting areas of strength and pinpointing opportunities for improvement.
How to Maximize these KPIs with MMM?
As eCommerce businesses seek to drive sustained growth, the centrality of KPIs in informing strategic decisions cannot be overstated. These indicators, when aptly understood and utilized, can paint a vivid picture of a business's health, pinpointing areas of strength and those in need of attention. However, the intricacies of profitability are woven by multiple threads of KPIs. Each KPI holds significance on its own, but it's their interplay that truly shapes the fabric of profitability.
Gross Margin After Returns:
- Relation to Profitability: This KPI reveals the true profitability after accounting for returns. In eCommerce, where return rates can be high, understanding your gross margin post-returns is essential to gauge actual earnings.
- Maximizing with MMM: MMM can help quantify the effect of various media channels on the return rate. For instance, if a particular advertising campaign is bringing in customers who return products at a higher rate, it might be more cost-effective to allocate budget elsewhere.
Gross Margin After Returns for New and Returning Customers:
- Relation to Profitability: Differentiating between new and old customers helps businesses understand customer loyalty and retention. Generally, retaining old customers is more cost-effective than acquiring new ones, and they tend to return items less frequently.
- Maximizing with MMM: MMM can segment the impact of media efforts between new and old customers. This can help allocate the marketing budget effectively, prioritizing channels that retain customers or bring high-quality new ones.
Gross Margin After Returns and Shipping Cost:
- Relation to Profitability: This metric offers a comprehensive insight into the costs and returns of every sale. Shipping can be a significant cost, especially for bulky items or international shipments.
- Maximizing with MMM: Using MMM, businesses can study how different marketing channels influence shipping costs. For instance, campaigns targeting local audiences might result in lower shipping costs compared to those targeting international ones.
Adding the Real Country from CRM:
- Relation to Profitability: Segmenting data by country helps businesses understand regional profitability. Some regions might be more profitable than others due to factors like lower return rates, higher order values, or lower shipping costs.
- Maximizing with MMM: With MMM, businesses can assess the effectiveness of regional marketing campaigns. It helps in understanding which markets respond best to which media channels, thus allowing for optimized allocation of marketing budgets.
Key takeaways:
Segmentation Enhances Insight: Breaking down the Gross Margin After Returns by new versus old customers offers deeper insights into customer behavior. This segmentation can highlight potential areas of trust and familiarity among loyal customers or indicate areas for improvement in onboarding or product clarity for newer ones.
Holistic Profitability: Incorporating both return rates and shipping costs into the Gross Margin gives a comprehensive understanding of the actual profit on every order. Recognizing how shipping costs, especially for heavy items or overseas shipments, impact profitability can guide pricing and shipping strategies.
Region-Specific Analysis: Utilizing real country data from CRM combined with other KPIs can lead to region-specific insights. This allows businesses to tailor strategies based on cultural preferences, logistical challenges, or the effectiveness of local marketing efforts, ensuring a more targeted and efficient approach.
In the next article will focus on KPIs that will help you understand the scalability of your business.
Curious to learn more? Book a demo.
Related articles
Read more postsNo items found!